20 min to read
Troubleshooting Kubernetes Networks in Cilium CNI Environments
Understanding eBPF-based packet processing and effective monitoring strategies in mixed Cilium + IPVS environments
Overview
Cilium is a next-generation CNI plugin based on eBPF that can be used alongside traditional kube-proxy or completely replace it. This guide covers the unique characteristics and troubleshooting methods for mixed Cilium + kube-proxy environments.
The lab exercises in this guide use the same environment setup from the Complete Kubernetes Internal Network Analysis: Packet Flow Tracing in IPVS Mode article.
Environment Characteristics
Before diving into troubleshooting, it’s essential to understand your current environment configuration.
Lab Environment Overview
network-test-info.sh
#!/bin/bash

NAMESPACE="network-test"

echo "======================================"
echo "  Kubernetes Network Test Environment"
echo "======================================"
echo ""

# Service IP
SERVICE_IP=$(kubectl get svc nginx-service -n $NAMESPACE -o jsonpath='{.spec.clusterIP}')
echo "Service ClusterIP: $SERVICE_IP"
echo ""

# Client Pod IP
CLIENT_IP=$(kubectl get pod client-pod -n $NAMESPACE -o jsonpath='{.status.podIP}' 2>/dev/null)
CLIENT_NODE=$(kubectl get pod client-pod -n $NAMESPACE -o jsonpath='{.spec.nodeName}' 2>/dev/null)
echo "Client Pod:"
echo "  IP: $CLIENT_IP"
echo "  Node: $CLIENT_NODE"
echo ""

# Backend Pod IPs
echo "Backend Pods:"
kubectl get pods -n $NAMESPACE -l app=nginx -o custom-columns=NAME:.metadata.name,IP:.status.podIP,NODE:.spec.nodeName --no-headers | while read name ip node; do
    echo "  $name"
    echo "    IP: $ip"
    echo "    Node: $node"
done
echo ""

# Endpoints
echo "Endpoints:"
ENDPOINTS=$(kubectl get endpoints nginx-service -n $NAMESPACE -o jsonpath='{.subsets[0].addresses[*].ip}' 2>/dev/null)
echo "  $ENDPOINTS"
echo ""

# 첫 번째 백엔드 IP
BACKEND_IP=$(echo $ENDPOINTS | awk '{print $1}')

echo "======================================"
echo "  Useful Commands"
echo "======================================"
echo ""
echo "# Export variables:"
echo "export SERVICE_IP=$SERVICE_IP"
echo "export CLIENT_IP=$CLIENT_IP"
echo "export BACKEND_IP=$BACKEND_IP"
echo ""
echo "# IPVS rules on $CLIENT_NODE:"
echo "ssh $CLIENT_NODE 'sudo ipvsadm -Ln | grep -A 5 $SERVICE_IP'"
echo ""
echo "# tcpdump on client pod:"
echo "kubectl exec -it client-pod -n $NAMESPACE -- tcpdump -i any -nn \"host $SERVICE_IP or host $BACKEND_IP\" -w /tmp/client.pcap"
echo ""
echo "# tcpdump on node:"
echo "ssh $CLIENT_NODE 'sudo tcpdump -i any -nn \"host $SERVICE_IP or host $BACKEND_IP\" -w /tmp/node.pcap'"
echo ""
./network-test-info.sh
======================================
  Kubernetes Network Test Environment
======================================

Service ClusterIP: 10.233.9.232

Client Pod:
  IP: 10.233.66.94
  Node: k8s-compute-02

Backend Pods:
  nginx-54c98b4f84-ftvlg
    IP: 10.233.66.111
    Node: k8s-compute-02
  nginx-54c98b4f84-tgmgh
    IP: 10.233.65.212
    Node: k8s-compute-01
  nginx-54c98b4f84-vzgjc
    IP: 10.233.67.86
    Node: k8s-compute-03

Endpoints:
  10.233.65.212 10.233.66.111 10.233.67.86

======================================
  Useful Commands
======================================

# Export variables:
export SERVICE_IP=10.233.9.232
export CLIENT_IP=10.233.66.94
export BACKEND_IP=10.233.65.212

# IPVS rules on k8s-compute-02:
ssh k8s-compute-02 'sudo ipvsadm -Ln | grep -A 5 10.233.9.232'

# tcpdump on client pod:
kubectl exec -it client-pod -n network-test -- tcpdump -i any -nn "host 10.233.9.232 or host 10.233.65.212" -w /tmp/client.pcap

# tcpdump on node:
ssh k8s-compute-02 'sudo tcpdump -i any -nn "host 10.233.9.232 or host 10.233.65.212" -w /tmp/node.pcap'
Step 1: Verify Current Environment
# 1. Check kube-proxy status
kubectl get pods -n kube-system | grep kube-proxy

# 2. Check kube-proxy mode
kubectl get cm kube-proxy -n kube-system -o yaml | grep mode

# 3. Check Cilium KubeProxyReplacement setting
kubectl -n kube-system exec -it ds/cilium -- cilium status | grep KubeProxyReplacement
# Expected output
kube-proxy-6lw4l         1/1     Running   1 (70d ago)   103d
mode: ipvs
KubeProxyReplacement:    False
Step 2: Environment Type Classification
| kube-proxy | Mode | KubeProxyReplacement | Environment Type |
|---|---|---|---|
| ✅ Running | ipvs | False | Cilium + IPVS Mixed |
| ✅ Running | iptables | False | Cilium + iptables Mixed |
| ❌ Not Running | - | True | Cilium Full Replacement |
| ✅ Running | ipvs | - | Pure IPVS |
Primary Symptom: IPVS Statistics Show Zero
Symptom Verification
sudo ipvsadm -Ln --stats | grep -A 5 "10.233.9.232"
TCP  10.233.9.232:80 rr
  -> 10.233.65.212:80             Masq    0      0          0
  -> 10.233.66.111:80             Masq    0      0          0
  -> 10.233.67.86:80              Masq    0      0          0
All statistics show 0! However, curl http://nginx-service works perfectly fine.
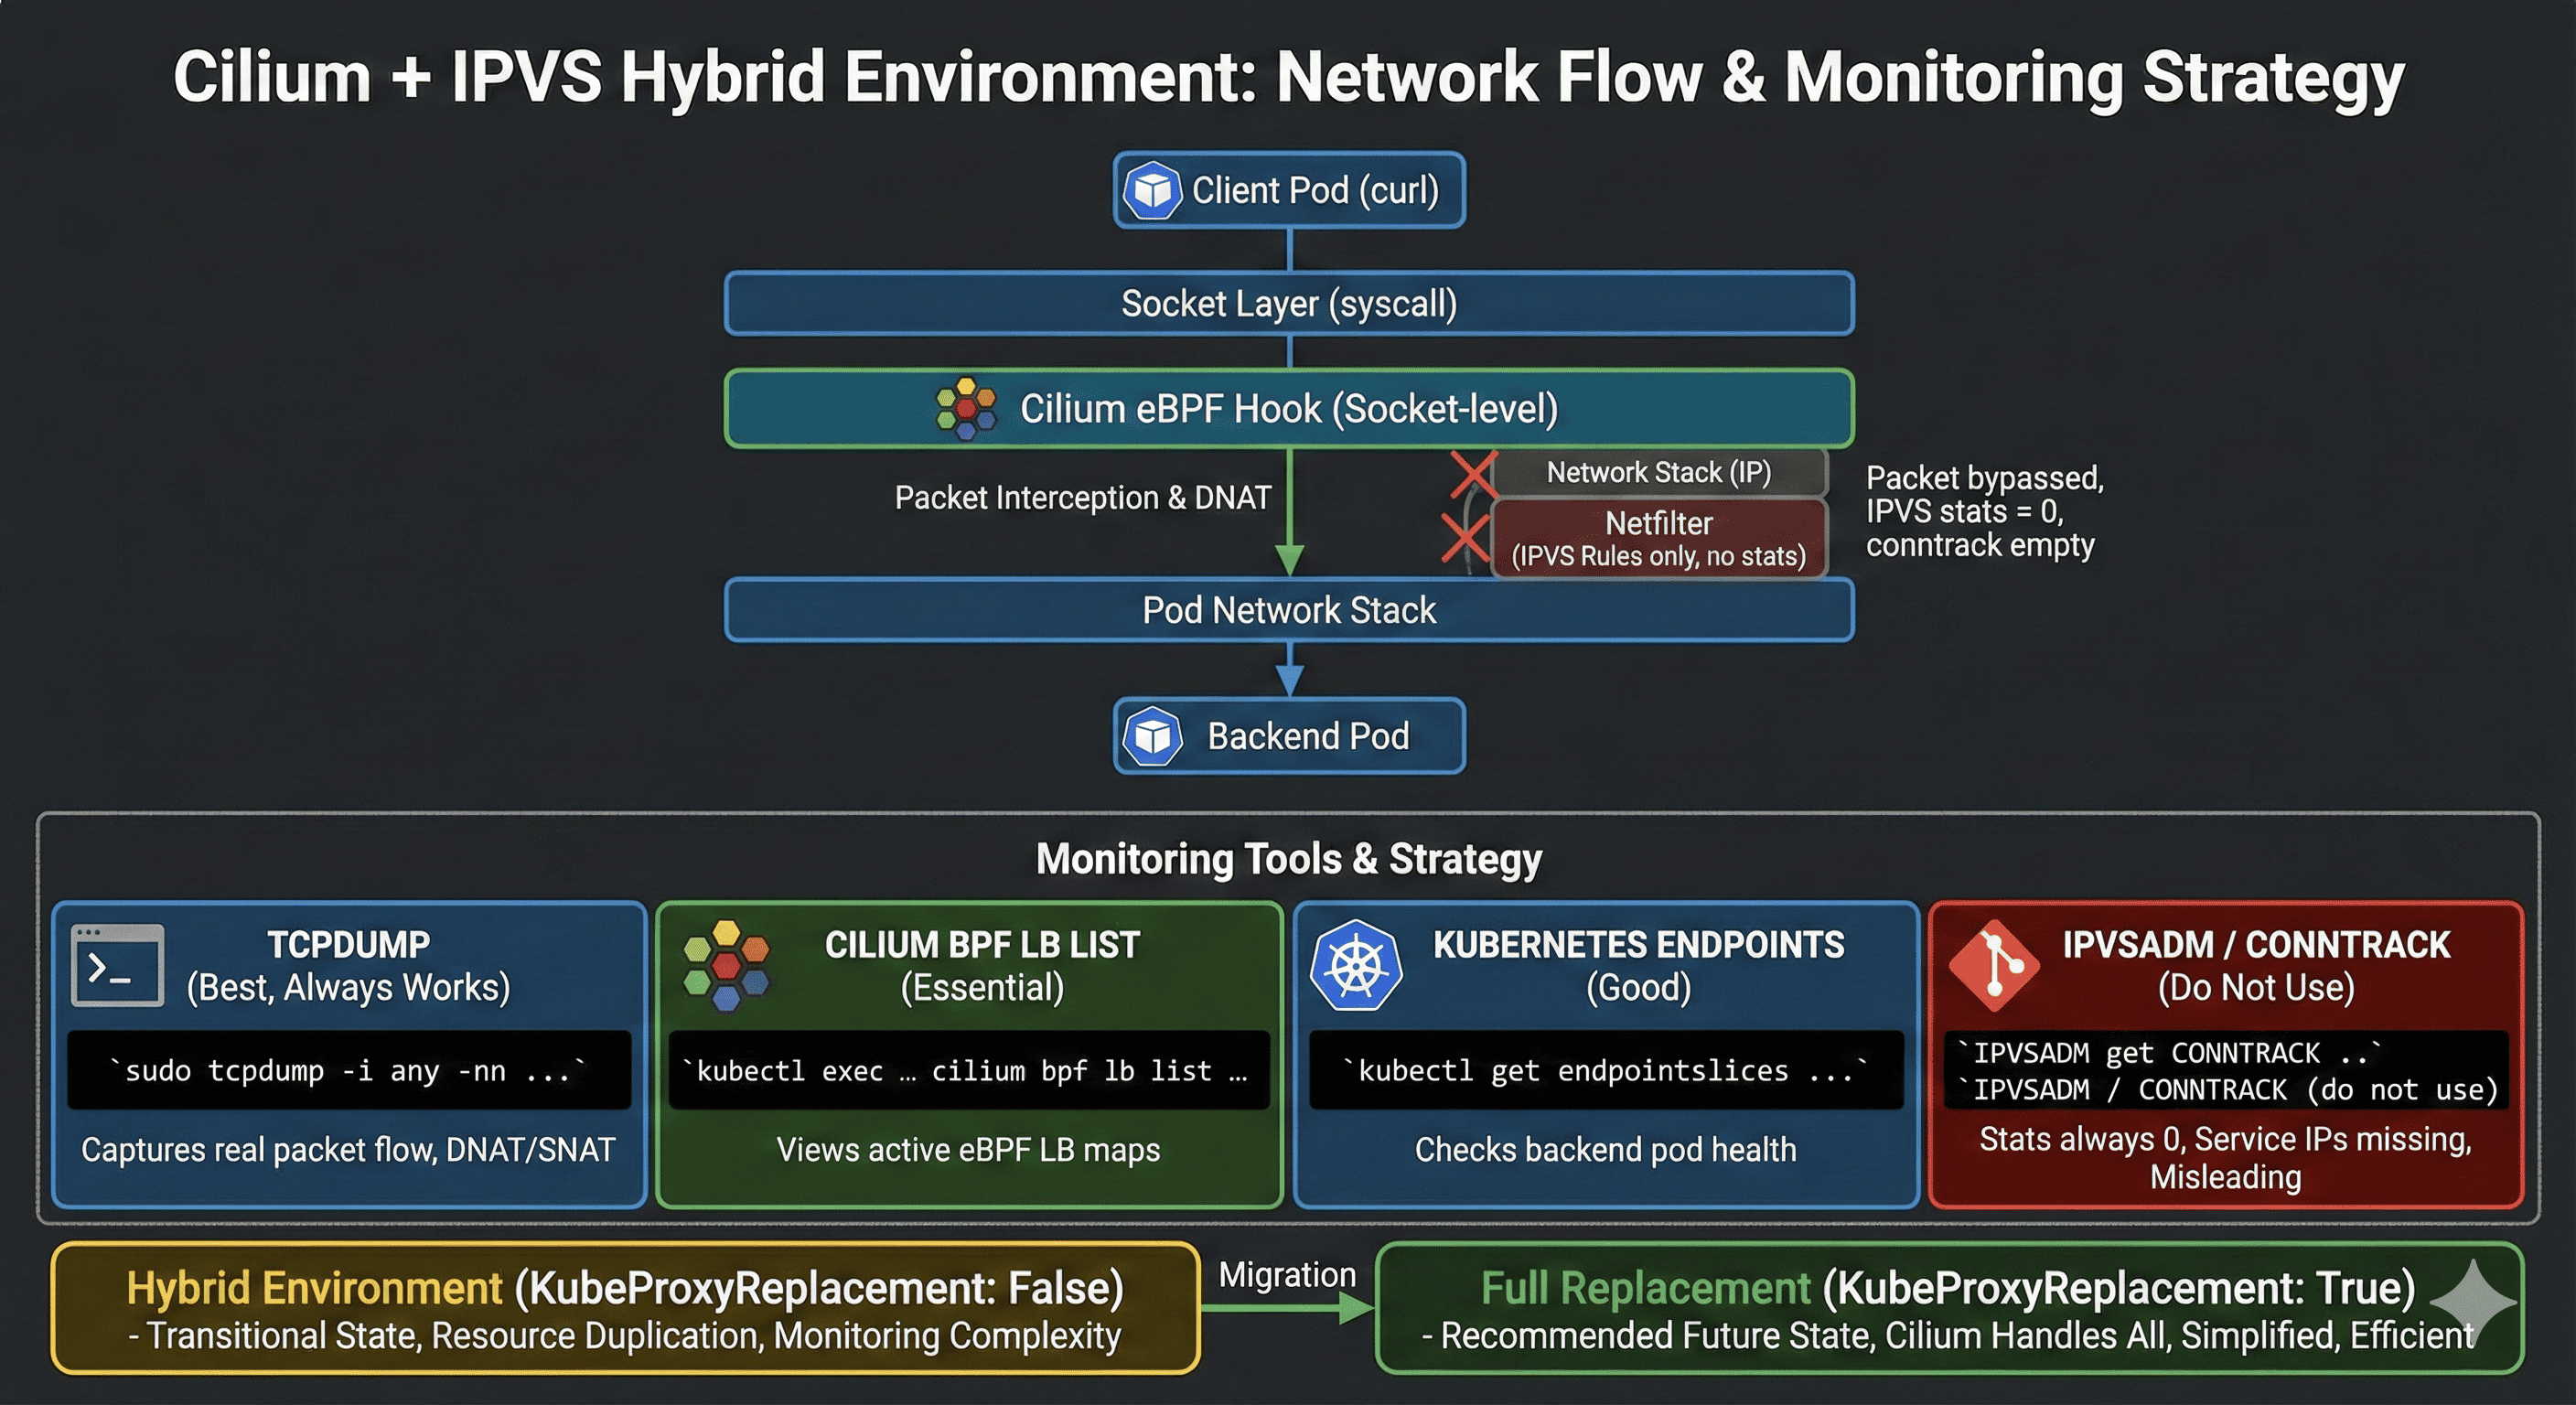
Root Cause
Cilium eBPF intercepts packets at the Socket-level before they reach IPVS.
(Socket-level)"] Socket["Socket Layer"] Transport["Transport (TCP)"] Network["Network (IP)"] IPVS["IPVS/Netfilter
(Rules exist but no packets)"] DataLink["Data Link Layer"] App -->|syscall| eBPF eBPF -->|"Intercepted here!"| Socket Socket --> Transport Transport --> Network Network -.->|"Packets never reach"| IPVS Network --> DataLink end
Consequences
- IPVS rules are created (kube-proxy is running)
- Actual packets are processed by eBPF
- IPVS statistics are always 0
- Linux conntrack is also bypassed (Socket-level processing)
Cilium Environment Monitoring Methods
Tool Effectiveness Summary
| Method | Works? | Recommended | Notes |
|---|---|---|---|
| cilium bpf lb list | ✅ Perfect | ⭐⭐⭐⭐⭐ | Most reliable method! |
| tcpdump | ✅ Perfect | ⭐⭐⭐⭐⭐ | Packet-level analysis |
| cilium monitor | ⚠️ Partial | ⭐⭐ | L7 not visible |
| conntrack -L | ❌ No | ⭐ | Bypassed by eBPF |
| cilium service list | ❌ Empty | ⭐ | Disabled in mixed mode |
| ipvsadm --stats | ❌ Always 0 | ⭐ | Reference only |
Method 1: eBPF Load Balancing Map (★★★★★)
kubectl -n kube-system exec -it ds/cilium -- cilium bpf lb list | grep 10.233.9.232
10.233.9.232:80/TCP (1)      10.233.67.86:80/TCP (79) (1)
10.233.9.232:80/TCP (3)      10.233.65.212:80/TCP (79) (3)
10.233.9.232:80/TCP (2)      10.233.66.111:80/TCP (79) (2)
10.233.9.232:80/TCP (0)      0.0.0.0:0 (79) (0) [ClusterIP, non-routable]
Interpretation:
- (0): Master entry (virtual server)
- (1), (2), (3): Backend slot numbers
- 10.233.67.86:80, 10.233.65.212:80, 10.233.66.111:80: Actual backend Pod IPs
- (79): RevNAT ID (for response packet processing)
Method 2: Cilium Service List (★)
This does not work in mixed environments.
kubectl -n kube-system exec -it ds/cilium -- cilium service list | grep nginx
# No output
Reason:
- In
KubeProxyReplacement: Falseenvironments, Cilium doesn’t directly manage Services - kube-proxy handles Service management
- Cilium’s Service list is empty
Use cilium bpf lb list instead! ← This queries the actual eBPF dataplane.
Method 3: conntrack Real-Time Monitoring (★)
This does not work in Cilium eBPF environments.
# Attempt 1
sudo conntrack -L -p tcp --dport 80 | grep 10.233.9.232
conntrack v1.4.8 (conntrack-tools): 6 flow entries have been shown.
# No Service IP related connections!
# Attempt 2 (without port filter)
sudo conntrack -L | grep 10.233.9.232
conntrack v1.4.8 (conntrack-tools): 888 flow entries have been shown.
# Still no Service IP related connections!
Cause:
- Cilium eBPF processes at Socket-level
- Bypasses the Linux kernel network stack
- Completely circumvents Netfilter conntrack
- Service IP (10.233.9.232) is not recorded in conntrack
Method 4: tcpdump (★★★★★)
The most reliable tool that always works!
# All traffic related to Service IP
sudo tcpdump -i any -nn host 10.233.9.232
Terminal 1:
ssh k8s-compute-02
sudo tcpdump -i any -nn "host 10.233.9.232 or port 80"
Terminal 2:
kubectl exec -it client-pod -n network-test -- bash -c "for i in {1..5}; do echo Request $i; curl -s http://nginx-service; sleep 1; done"
Terminal 1 Output:
12:15:36.180603 In  10.233.66.94.34376 > 10.233.9.232.80: Flags [S], seq 1234567890
12:15:36.180621 Out 10.233.66.94.34376 > 10.233.65.212.80: Flags [S], seq 1234567890
12:15:36.180869 P   10.233.65.212.80 > 10.233.66.94.34376: Flags [S.], seq 9876543210
12:15:36.180901 Out 10.233.9.232.80 > 10.233.66.94.34376: Flags [S.], seq 9876543210
You can observe both pre and post DNAT/SNAT packets!
Method 5: Cilium Monitor (★★)
Works with limitations.
kubectl -n kube-system exec -it ds/cilium -- cilium monitor
Results:
- General traffic is visible
- nginx Service traffic is not visible (L7 visibility disabled)
# Attempt L7 traffic (may not work)
kubectl -n kube-system exec -it ds/cilium -- cilium monitor --type l7
Press Ctrl-C to quit
# No nginx related traffic
# Only other application traffic visible
Cause:
- L7 visibility is disabled in
KubeProxyReplacement: Falseenvironments - eBPF processes too early at Socket-level
Practical Troubleshooting Scenarios
Scenario 1: Service Responds Normally but IPVS Statistics Are Zero
Symptom:
# curl works fine
kubectl exec -it client-pod -n network-test -- curl http://nginx-service
Backend POD-1: nginx-54c98b4f84-ftvlg

# IPVS statistics are 0
sudo ipvsadm -Ln --stats | grep 10.233.9.232
TCP  10.233.9.232:80 rr
  -> 10.233.65.212:80             Masq    0      0          0
Diagnosis:
# 1. Check Cilium eBPF map (most important!)
kubectl -n kube-system exec -it ds/cilium -- cilium bpf lb list | grep 10.233.9.232

# 2. Verify actual packets with tcpdump
sudo tcpdump -i any -nn host 10.233.9.232 -c 10
Conclusion: This is normal behavior in Cilium mixed environments. IPVS statistics should be ignored.
Scenario 2: Connections Not Visible in conntrack
Symptom:
sudo conntrack -L | grep 10.233.9.232
conntrack v1.4.8 (conntrack-tools): 888 flow entries have been shown.
# Nothing found
Cause:
- Cilium eBPF processes at Socket-level
- Completely bypasses Linux conntrack
Solution:
# Use tcpdump instead of conntrack
sudo tcpdump -i any -nn "host 10.233.9.232 or port 80"

# Or check Cilium eBPF map
kubectl -n kube-system exec -it ds/cilium -- cilium bpf lb list | grep 10.233.9.232
Conclusion: It’s normal if conntrack shows nothing. Use tcpdump instead.
Scenario 3: Traffic Not Visible in Cilium Monitor
Symptom:
kubectl -n kube-system exec -it ds/cilium -- cilium monitor --type l7
# No nginx traffic
Solution:
# Check regular monitor
kubectl -n kube-system exec -it ds/cilium -- cilium monitor

# Or use tcpdump
sudo tcpdump -i any -nn port 80
Conclusion: It’s normal if L7 monitor shows nothing.
Scenario 4: Service Connection Failure
Symptom:
kubectl exec -it client-pod -n network-test -- curl http://nginx-service
curl: (7) Failed to connect to nginx-service port 80: Connection timeout
Diagnostic Steps:
# 1. Verify Service exists
kubectl get svc nginx-service -n network-test

# 2. Check Endpoints
kubectl get endpointslices -n network-test

# 3. Check Cilium eBPF map (most important!)
kubectl -n kube-system exec -it ds/cilium -- cilium bpf lb list | grep 10.233.9.232

# 4. Check IPVS rules (reference only)
sudo ipvsadm -Ln | grep 10.233.9.232

# 5. Test direct Pod access
BACKEND_IP=$(kubectl get pods -n network-test -l app=nginx -o jsonpath='{.items[0].status.podIP}')
kubectl exec -it client-pod -n network-test -- curl http://$BACKEND_IP

# 6. Check packets with tcpdump
sudo tcpdump -i any -nn host 10.233.9.232
Possible Causes and Solutions:
| Symptom | Cause | Solution |
|---|---|---|
| Service not found | Not created | Re-run kubectl expose |
| No Endpoints | Pods not running | Check Pod status |
| eBPF map empty | Cilium agent issue | Restart Cilium |
| Direct access fails | Network Policy | Review policies |
| No packets visible | CNI issue | Check CNI logs |
Cilium Agent Restart:
kubectl rollout restart ds/cilium -n kube-system
kubectl rollout status ds/cilium -n kube-system
Packet Flow Comparison
Pure IPVS Environment
10.233.66.94"] NetStack1["Network Stack"] Netfilter["Netfilter
PREROUTING"] IPVS["IPVS
DNAT performed"] PodNet1["Pod Network"] Backend1["Backend Pod
10.233.65.212"] Client -->|"10.233.66.94 → 10.233.9.232:80"| NetStack1 NetStack1 --> Netfilter Netfilter --> IPVS IPVS -->|"10.233.66.94 → 10.233.65.212:80"| PodNet1 PodNet1 --> Backend1 end
Cilium Mixed Environment (Current Setup)
10.233.66.94"] eBPF["Cilium eBPF Hook
DNAT at Socket-level"] Socket["Socket Layer"] NetStack2["Network Stack"] IPVS2["Netfilter/IPVS
(Rules exist, no packets)"] PodNet2["Pod Network"] Backend2["Backend Pod
10.233.65.212"] Client2 -->|"curl syscall"| eBPF eBPF -->|"10.233.66.94 → 10.233.65.212:80"| Socket Socket --> NetStack2 NetStack2 -.->|"Packets never reach"| IPVS2 NetStack2 --> PodNet2 PodNet2 --> Backend2 end
Key Differences
| Aspect | IPVS Environment | Cilium Mixed Environment |
|---|---|---|
| Processing Location | Netfilter (PREROUTING) | Socket-level (syscall) |
| Processing Timing | Mid network stack | Immediately after syscall |
| conntrack | Recorded | Bypassed |
| IPVS Involvement | Actual processing | Rules only |
| Performance | Very fast | Faster (syscall bypass) |
| Monitoring | ipvsadm, conntrack | tcpdump, cilium bpf |
Useful Command Reference
Cilium eBPF Map Commands (Most Important!)
tcpdump Commands
# All traffic related to Service IP
sudo tcpdump -i any -nn host 10.233.9.232

# Between Client and Service
sudo tcpdump -i any -nn "host 10.233.66.94 and host 10.233.9.232"

# HTTP traffic only
sudo tcpdump -i any -nn port 80

# Save to file for later analysis
sudo tcpdump -i any -nn host 10.233.9.232 -w /tmp/capture.pcap
tcpdump -r /tmp/capture.pcap -nn -v
Cilium Status Commands
# Full status
kubectl -n kube-system exec -it ds/cilium -- cilium status

# Check KubeProxyReplacement
kubectl -n kube-system exec -it ds/cilium -- cilium status | grep KubeProxyReplacement

# Cilium version
kubectl -n kube-system exec -it ds/cilium -- cilium version
Cilium Endpoint Commands
# Endpoint list
kubectl -n kube-system exec -it ds/cilium -- cilium endpoint list

# Search by specific IP
kubectl -n kube-system exec -it ds/cilium -- cilium endpoint list | grep 10.233.66.111
Cilium Monitor Commands
# All events
kubectl -n kube-system exec -it ds/cilium -- cilium monitor

# Drop events
kubectl -n kube-system exec -it ds/cilium -- cilium monitor --type drop
IPVS Commands (Reference Only)
# Check rules
sudo ipvsadm -Ln | grep -A 5 "10.233.9.232"

# Statistics (always 0)
sudo ipvsadm -Ln --stats
conntrack Commands (Doesn’t Work)
# Can try but Service IP won't appear
sudo conntrack -L | grep 10.233.9.232
Environment-Specific Monitoring Strategies
Cilium + IPVS Mixed Environment (KubeProxyReplacement: False)
In this environment, Cilium eBPF processes packets at the Socket-level first, so traditional IPVS/conntrack-based monitoring tools don’t work properly.
Priority 1: tcpdump
# Most reliable method - always works
sudo tcpdump -i any -nn "host $SERVICE_IP or port 80"
Priority 2: Cilium eBPF Map
# Check Service load balancing status
kubectl -n kube-system exec -it ds/cilium -- cilium bpf lb list | grep $SERVICE_IP
Priority 3: Kubernetes Resources
# Check backend status via EndpointSlice
kubectl get endpointslices -n $NAMESPACE -o wide
Tools to Avoid:
ipvsadm --stats: Always 0 (reference only)conntrack -L: Service IP not visiblecilium service list: Empty in mixed environments
Cilium Full Replacement Environment (KubeProxyReplacement: True)
An environment where kube-proxy doesn’t exist and Cilium handles all Service processing.
Priority 1: Cilium Service List
# Only works in full replacement environment
kubectl -n kube-system exec -it ds/cilium -- cilium service list
Priority 2: Cilium eBPF Map
kubectl -n kube-system exec -it ds/cilium -- cilium bpf lb list
Priority 3: Cilium Monitor
# Detailed info available when L7 visibility is enabled
kubectl -n kube-system exec -it ds/cilium -- cilium monitor --type l7
Mixed vs Full Replacement Comparison
| Aspect | Mixed Environment | Full Replacement |
|---|---|---|
| kube-proxy | Running | Not present |
| KubeProxyReplacement | False | True |
| Service Management | kube-proxy | Cilium |
| Packet Processing | Cilium eBPF | Cilium eBPF |
| IPVS Rules | Exist but unused | None |
| cilium service list | Empty | Works |
| cilium bpf lb list | Works | Works |
| Resource Usage | High (duplicate) | Low |
| Complexity | High | Low |
Pros and Cons of Mixed Environment
Advantages:
- Gradual migration from existing environment possible
- Theoretical fallback to kube-proxy if Cilium has issues
- Partial preservation of existing monitoring infrastructure
Disadvantages:
- Duplicate resource usage (both kube-proxy and Cilium running)
- Monitoring confusion (IPVS stats 0, conntrack bypassed)
- Increased debugging complexity
- In reality, only Cilium processes packets (kube-proxy is meaningless)
Recommended Scenarios for Full Replacement
Consider Cilium full replacement if you meet these conditions:
- Cilium version 1.12 or higher
- Kubernetes version 1.24 or higher
- Adequate test environment available
- Accumulated Cilium operational experience
- Network Policy managed by Cilium
Migration Considerations
Transitioning from Mixed to Full Replacement
Pre-flight Checks:
# Check Cilium version
kubectl -n kube-system exec -it ds/cilium -- cilium version

# Check current configuration
helm get values cilium -n kube-system

# Check cluster status
kubectl -n kube-system exec -it ds/cilium -- cilium status --verbose
Migration Considerations:
- Always validate in test environment first
- Establish rollback plan
- Update monitoring dashboards (remove IPVS metrics)
- Verify Network Policy compatibility
- Test NodePort and LoadBalancer type Service behavior
Post-Migration Verification:
# Verify kube-proxy removal
kubectl get pods -n kube-system | grep kube-proxy

# Verify Cilium full replacement
kubectl -n kube-system exec -it ds/cilium -- cilium status | grep KubeProxyReplacement

# Check Service list (should work now)
kubectl -n kube-system exec -it ds/cilium -- cilium service list
Lab Environment Cleanup
After completing the lab, clean up the created resources:
# Delete test namespace
kubectl delete namespace network-test

# Clean up local files
rm -f client.pcap node.pcap backend.pcap network-test-info.sh

# Clean up capture files on node
ssh k8s-compute-02 'sudo rm -f /tmp/*.pcap'
Verify Deletion:
kubectl get all -n network-test
# Output: No resources found in network-test namespace.
Conclusion
Key Takeaways
Understanding the unique characteristics of Cilium mixed environments is essential for effective troubleshooting.
The key is knowing which tools work and which don't in your specific environment.
Cilium + IPVS Mixed Environment Characteristics
- Cilium eBPF intercepts packets at Socket-level first
- IPVS rules exist but don’t participate in actual packet processing
- conntrack is also bypassed, making connection tracking unavailable
- Traditional monitoring tools (ipvsadm, conntrack) become ineffective
Monitoring Strategy
- tcpdump is the most reliable tool
- Use
cilium bpf lb listto check eBPF load balancing maps - IPVS statistics being 0 is normal behavior
- Service IP not appearing in conntrack is also normal
Troubleshooting Approach
- First, identify environment type (check KubeProxyReplacement value)
- Verify Service registration in Cilium eBPF map
- Trace actual packet flow with tcpdump
- Isolate network issues by testing direct Pod access
Recommendations
- Mixed environments are transitional; consider full replacement long-term
- Migrate monitoring infrastructure to Cilium-based tools
- Disable or modify IPVS metric-based alerts
References
- Cilium Documentation - KubeProxyReplacement
- Cilium Documentation - eBPF Datapath
- Cilium Documentation - Troubleshooting
- Cilium Documentation - Service Load Balancing
- Kubernetes Documentation - Service
- Kubernetes Documentation - Virtual IPs and Service Proxies
- eBPF Documentation
- Linux Kernel - IPVS
- tcpdump Manual

Comments