17 min to read
Linux Physical Server Hardware Monitoring Guide: Complete Toolkit
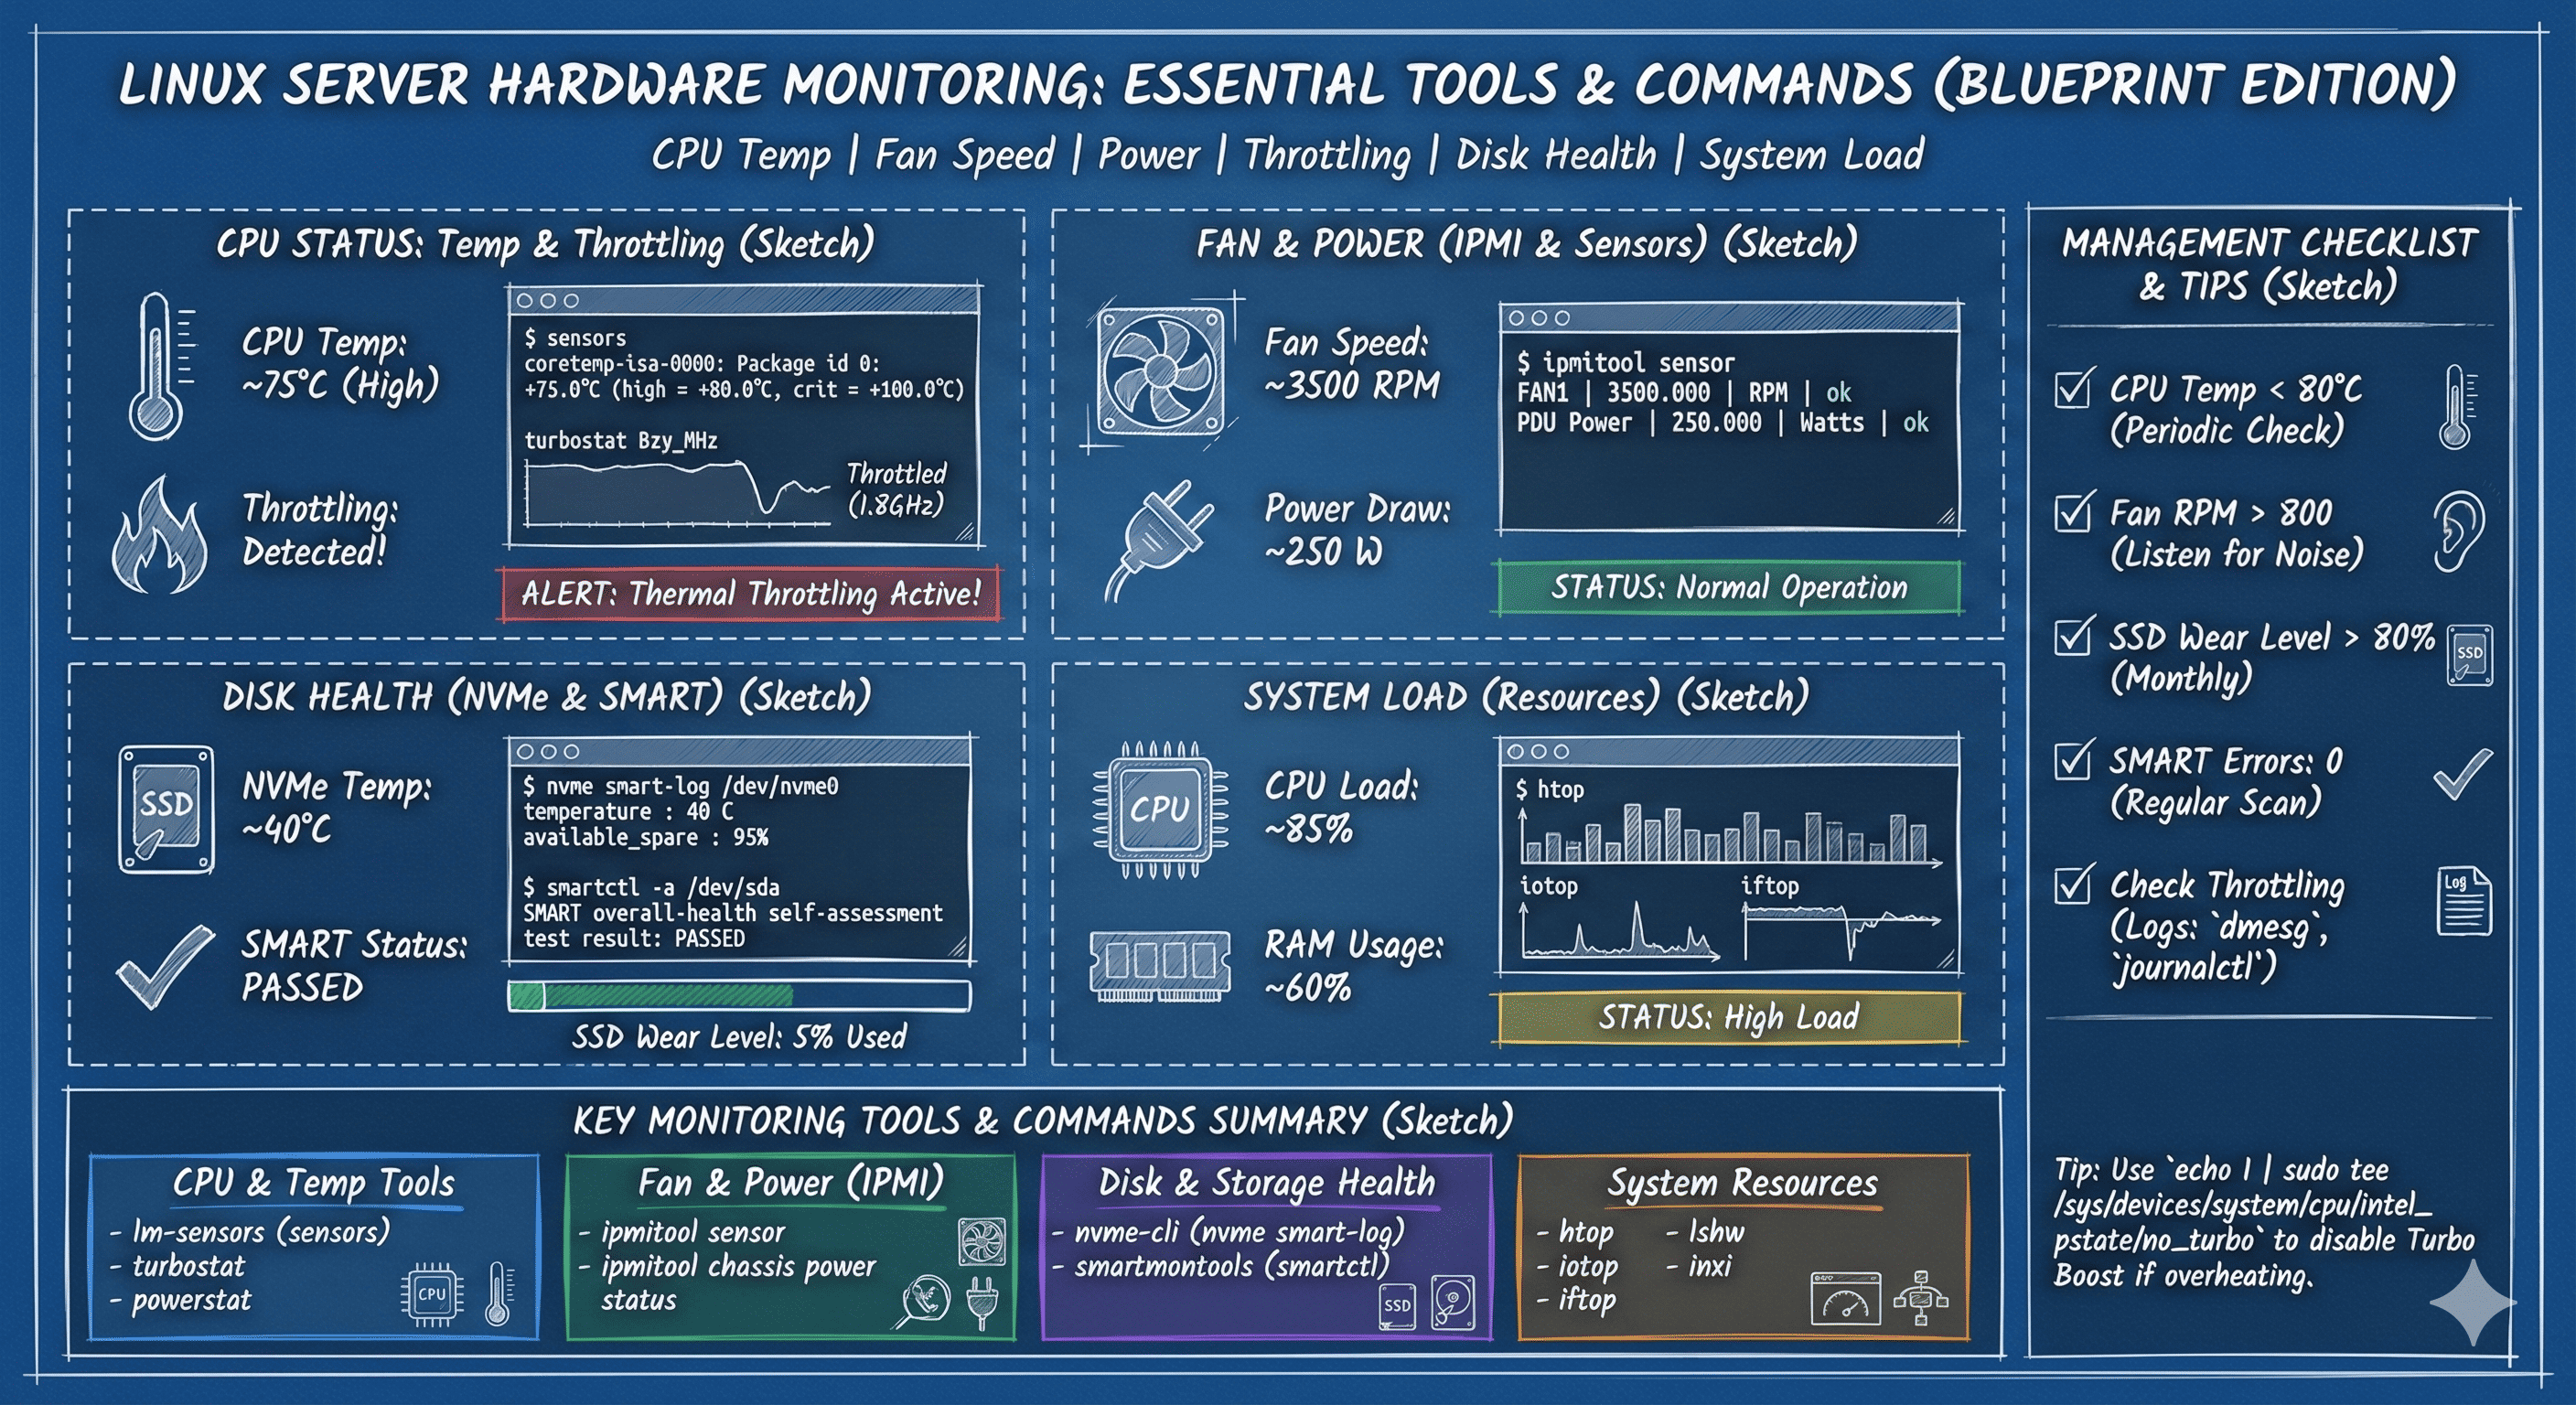
Monitoring CPU temperature, fan speed, voltage, power consumption, and throttling on bare-metal servers
Overview
When operating physical servers, it’s essential to monitor various hardware metrics such as CPU temperature, fan speed, voltage, power consumption, and throttling (performance degradation) status.
This article introduces various commands and tools for checking hardware sensor information and real-time management on Ubuntu-based Linux servers. We’ll cover tools applicable to servers from Supermicro, Dell, HP including ipmitool, lm-sensors, powerstat, and nvme-cli.
1. CPU Temperature Monitoring with lm-sensors
Installation and Detection
sudo apt install lm-sensors -y
sudo sensors-detect
Repeatedly enter YES to detect all available sensors:
coretemp(Intel CPU)nct6775(Fan, voltage sensors)
Example Detected Sensor Modules
coretemp
nct6775
it87
k10temp  # AMD CPUs
Load Kernel Modules Immediately
sudo modprobe coretemp
sudo modprobe nct6775
Display Sensor Values
sensors
Example Output:
coretemp-isa-0000
Adapter: ISA adapter
Package id 0:  +45.0°C  (high = +80.0°C, crit = +100.0°C)
Core 0:        +42.0°C  (high = +80.0°C, crit = +100.0°C)
Core 1:        +44.0°C  (high = +80.0°C, crit = +100.0°C)
Core 2:        +43.0°C  (high = +80.0°C, crit = +100.0°C)
Core 3:        +45.0°C  (high = +80.0°C, crit = +100.0°C)

nct6775-isa-0290
Adapter: ISA adapter
fan1:        1200 RPM  (min =  800 RPM)
fan2:        1150 RPM  (min =  800 RPM)
Tip: Add module names to /etc/modules for automatic loading after reboot:
echo "coretemp" | sudo tee -a /etc/modules
echo "nct6775" | sudo tee -a /etc/modules
2. System Resource Monitoring
Essential Monitoring Tools
| Tool | Purpose |
|---|---|
| htop | Real-time CPU, memory, thread monitoring (GUI-based) |
| iotop | Real-time disk read/write tracking |
| iftop | Network traffic tracking (per interface) |
htop - CPU and Memory
sudo apt install htop
htop
Key Features:
- Color-coded CPU usage bars
- Per-process CPU/memory consumption
- Load averages
- Thread view (F2 → Display options → Show custom thread names)
iotop - Disk I/O
sudo apt install iotop
sudo iotop
Useful Options:
sudo iotop -o  # Only show processes with I/O activity
sudo iotop -a  # Accumulated I/O instead of bandwidth
iftop - Network Traffic
sudo apt install iftop
sudo iftop -i eth0  # Specify interface
Key Shortcuts:
t- Toggle between one-line, two-line, three-line displayn- Toggle DNS resolutionp- Toggle port display
3. Fan Speed, Voltage, Power (IPMI-Supported Servers)
ipmitool Installation
sudo apt install ipmitool
View All Sensors
sudo ipmitool sensor
Example Output:
Temp             | 38.000     | degrees C  | ok    | na        | na        | na        | 85.000    | 90.000    | na
CPU Temp         | 45.000     | degrees C  | ok    | na        | na        | na        | 95.000    | 100.000   | na
FAN1             | 2400.000   | RPM        | ok    | 300.000   | 500.000   | 700.000   | 25300.000 | 25400.000 | 25500.000
FAN2             | 2350.000   | RPM        | ok    | 300.000   | 500.000   | 700.000   | 25300.000 | 25400.000 | 25500.000
Vcore            | 1.040      | Volts      | ok    | 0.640     | 0.720     | 0.800     | 1.520     | 1.600     | 1.680
12V              | 12.192     | Volts      | ok    | 10.176    | 10.416    | 10.656    | 12.960    | 13.200    | 13.440
PSU1 Status      | 0x1        | discrete   | 0x0100| na        | na        | na        | na        | na        | na
Requirements
IPMI must be enabled in BIOS or BMC:
- Supermicro: BMC configuration
- Dell: iDRAC
- HP: iLO (Integrated Lights-Out)
View Specific Sensors
# Temperature
sudo ipmitool sensor get "CPU Temp"

# Fan speed
sudo ipmitool sensor get "FAN1"

# Power supply status
sudo ipmitool sensor get "PSU1 Status"
4. Intel CPU Power Consumption and Throttling
powerstat
sudo apt install powerstat
sudo powerstat
Example Output:
Time    User  Nice   Sys  Idle    IO  Run Ctxt/s  IRQ/s   Watts
14:30:01  5.2   0.0   1.8  92.8   0.2    2   1234   2456   45.2
14:30:06  4.9   0.0   2.1  92.7   0.3    1   1198   2389   44.8
14:30:11  5.5   0.0   1.9  92.4   0.2    3   1267   2512   46.1
turbostat - Detailed CPU Metrics
sudo apt install linux-tools-common linux-tools-$(uname -r)
sudo turbostat
Key Metrics:
- Package: Package power consumption (Watts)
- Core: Core power consumption
- Frequency: Current CPU frequency
- C-state: Power-saving state depth
- Throttling: Performance throttling status
Example Output:
Core  CPU  Avg_MHz  Busy%  Bzy_MHz  TSC_MHz  Package  Core   PkgTmp  PkgWatt  CorWatt
-     -    1234     24.68   5000     2400     45       22     56      45.2     22.1
0     0    1200     24.00   5000     2400     45       22     55      -        -
0     4    1180     23.60   5000     2400     -        -      -       -        -
1     1    1290     25.80   5000     2400     -        23     56      -        -
1     5    1245     24.90   5000     2400     -        -      -       -        -
5. NVMe SSD Status and Temperature
nvme-cli Installation
sudo apt install nvme-cli
SMART Log
sudo nvme smart-log /dev/nvme0
Example Output:
Smart Log for NVME device:nvme0 namespace-id:ffffffff
critical_warning                    : 0
temperature                         : 45 C
available_spare                     : 100%
available_spare_threshold           : 10%
percentage_used                     : 2%
data_units_read                     : 12,345,678
data_units_written                  : 8,765,432
host_read_commands                  : 234,567,890
host_write_commands                 : 123,456,789
controller_busy_time                : 1,234
power_cycles                        : 50
power_on_hours                      : 8,760
unsafe_shutdowns                    : 0
media_errors                        : 0
num_err_log_entries                 : 0
Critical Metrics
| Metric | Description | Healthy Range |
|---|---|---|
| Temperature | Current SSD temperature | < 70°C |
| Available Spare | Remaining spare blocks | > 80% |
| Percentage Used | Wear indicator | < 80% |
| Media Errors | Bad sectors | 0 |
List All NVMe Devices
sudo nvme list
6. System Hardware Information Summary
lshw - Hardware Lister
sudo lshw -short
Example Output:
H/W path        Device      Class          Description
======================================================
                            system         Computer
/0                          bus            Motherboard
/0/0                        memory         32GiB System Memory
/0/1                        processor      Intel Core i7-9700K
/0/100/1c.4/0   eth0        network        Ethernet Controller
/0/100/1f.2                 storage        SATA Controller
inxi - System Information Tool
sudo apt install inxi
sudo inxi -Fxz
Features:
- CPU, GPU, Network card info
- Memory slot details
- Disk information
- Sensor readings
- Battery status (for laptops)
7. Disk Health (SMART) Check
smartmontools Installation
sudo apt install smartmontools
Full SMART Report
sudo smartctl -a /dev/sda
Key Attributes:
ID# ATTRIBUTE_NAME          FLAG     VALUE WORST THRESH TYPE      UPDATED  WHEN_FAILED RAW_VALUE
  5 Reallocated_Sector_Ct   0x0033   100   100   010    Pre-fail  Always       -       0
  9 Power_On_Hours          0x0032   099   099   000    Old_age   Always       -       8760
 12 Power_Cycle_Count       0x0032   100   100   000    Old_age   Always       -       50
194 Temperature_Celsius     0x0022   042   055   000    Old_age   Always       -       42
197 Current_Pending_Sector  0x0012   100   100   000    Old_age   Always       -       0
198 Offline_Uncorrectable   0x0010   100   100   000    Old_age   Offline      -       0
Critical Attributes to Monitor
| ID | Attribute | Critical? | Action |
|---|---|---|---|
| 5 | Reallocated Sectors | ⚠️ Yes | Replace if > 0 and increasing |
| 197 | Pending Sectors | ⚠️ Yes | Replace immediately if > 0 |
| 198 | Uncorrectable Sectors | ⚠️ Yes | Replace immediately if > 0 |
| 194 | Temperature | ⚠️ Monitor | Check cooling if > 55°C |
Test Disk
# Short test (2 minutes)
sudo smartctl -t short /dev/sda

# Long test (hours)
sudo smartctl -t long /dev/sda

# View test results
sudo smartctl -l selftest /dev/sda
8. Thermal Throttling Manual Check
Thermal Zone Temperatures
cat /sys/class/thermal/thermal_zone*/temp
Output is in millidegrees Celsius (divide by 1000):
45000  # 45°C
52000  # 52°C
Intel Turbo Boost Status
cat /sys/devices/system/cpu/intel_pstate/no_turbo
Values:
0: Turbo Boost enabled (default)1: Turbo Boost disabled
Disable Turbo Boost
echo 1 | sudo tee /sys/devices/system/cpu/intel_pstate/no_turbo
Use Cases:
- Reduce heat during sustained high load
- Lower power consumption
- Stabilize performance (avoid frequency fluctuations)
Re-enable Turbo Boost
echo 0 | sudo tee /sys/devices/system/cpu/intel_pstate/no_turbo
9. IPMI Remote Access Configuration
Enable IPMI LAN in BIOS
If IPMI LAN is enabled in BIOS, you can access remotely:
ipmitool -I lanplus -H <IPMI_IP> -U ADMIN -P ADMIN sensor
Web UI Access
http://<IPMI_IP>
Vendor-Specific Names:
- Supermicro: BMC (Baseboard Management Controller)
- Dell: iDRAC (Integrated Dell Remote Access Controller)
- HP: iLO (Integrated Lights-Out)
Common IPMI Commands
# System information
ipmitool -I lanplus -H <IP> -U <USER> -P <PASS> fru print

# SEL (System Event Log)
ipmitool -I lanplus -H <IP> -U <USER> -P <PASS> sel list

# Power status
ipmitool -I lanplus -H <IP> -U <USER> -P <PASS> chassis power status
10. System Power and Fan RPM Control
Power Management
# Check power status
ipmitool chassis power status

# Power on
ipmitool chassis power on

# Power off
ipmitool chassis power off

# Hard reset
ipmitool chassis power cycle

# Soft shutdown
ipmitool chassis power soft
Fan Control
# Get specific fan status
ipmitool sensor get "FAN1"

# Set fan to manual mode (Supermicro)
ipmitool raw 0x30 0x45 0x01 0x00

# Set fan speed (0-100%)
ipmitool raw 0x30 0x70 0x66 0x01 0x00 0x64  # 100%
ipmitool raw 0x30 0x70 0x66 0x01 0x00 0x32  # 50%

# Return to automatic mode
ipmitool raw 0x30 0x45 0x01 0x01
⚠️ Warning: Manual fan control can lead to overheating. Monitor temperatures closely.
11. Detailed CPU Throttling Diagnostics
turbostat Advanced Usage
sudo turbostat --Summary --interval 5
Key Fields
| Field | Description |
|---|---|
| PkgWatt | Package power consumption (Watts) |
| CorWatt | Core power consumption (Watts) |
| PkgTmp | Package temperature (°C) |
| GFXMHz | Integrated GPU clock (MHz) |
| Busy% | CPU utilization percentage |
| Bzy_MHz | Average frequency when busy |
| CPU%c1 | C1 state residency (light sleep) |
| CPU%c6 | C6 state residency (deep sleep) |
Interpreting Results
Normal Operation:
Bzy_MHz close to base frequency
Low C6 residency during load
Temperature < 80°C
Throttling Detected:
Bzy_MHz significantly below base frequency
High temperature (> 90°C)
Frequent C6 entries under load
12. Tracking Thermal Events
Kernel Messages
dmesg | grep -i thermal
Example Output:
[  567.890123] thermal thermal_zone0: critical temperature reached (100 C), shutting down
[  890.123456] CPU0: Package temperature above threshold, cpu clock throttled
System Logs
journalctl -k | grep -i throttle
journalctl -k | grep -i thermal
Continuous Monitoring
# Watch thermal events in real-time
watch -n 1 'dmesg | grep -i thermal | tail -20'
Management Tips and Checklist
Monitoring Checklist
| Item | Recommended Range | Check Frequency |
|---|---|---|
| CPU Temperature | 35~80°C | Regular (sensors) |
| FAN RPM | > 800 RPM | When noise increases |
| SSD Wear Level | > 80% remaining | Monthly |
| SMART Errors | 0 | Weekly |
| IPMI Sensor Anomalies | None | During load increases |
| Turbo Status | Enabled (unless thermal issues) | When throttling suspected |
Alert Thresholds
# Example threshold script
#!/bin/bash

CPU_TEMP=$(sensors | grep 'Package id 0' | awk '{print $4}' | sed 's/+//;s/°C//')
FAN_RPM=$(sensors | grep 'fan1' | awk '{print $2}')
DISK_TEMP=$(smartctl -A /dev/sda | grep Temperature | awk '{print $10}')

if (( $(echo "$CPU_TEMP > 85" | bc -l) )); then
    echo "ALERT: CPU temperature critical: ${CPU_TEMP}°C"
fi

if (( FAN_RPM < 800 )); then
    echo "ALERT: Fan speed low: ${FAN_RPM} RPM"
fi

if (( DISK_TEMP > 55 )); then
    echo "ALERT: Disk temperature high: ${DISK_TEMP}°C"
fi
Integration with Monitoring Systems
Prometheus + Node Exporter
# Install node_exporter
wget https://github.com/prometheus/node_exporter/releases/download/v1.6.1/node_exporter-1.6.1.linux-amd64.tar.gz
tar xvfz node_exporter-1.6.1.linux-amd64.tar.gz
sudo mv node_exporter-1.6.1.linux-amd64/node_exporter /usr/local/bin/
Systemd Service (/etc/systemd/system/node_exporter.service):
[Unit]
Description=Node Exporter
After=network.target

[Service]
User=node_exporter
ExecStart=/usr/local/bin/node_exporter --collector.hwmon

[Install]
WantedBy=multi-user.target
Grafana Dashboard
Import dashboard ID: 1860 (Node Exporter Full)
Key Panels:
- CPU Temperature
- Fan Speeds
- Disk I/O
- Network Traffic
- Power Consumption
SNMP Integration
sudo apt install snmpd snmp

# Configure /etc/snmp/snmpd.conf
rocommunity public
syslocation "Datacenter 1"
syscontact "admin@example.com"

# Restart service
sudo systemctl restart snmpd
Troubleshooting Common Issues
Issue 1: sensors-detect Finds No Sensors
Solutions:
# Update kernel
sudo apt update && sudo apt upgrade

# Load generic driver
sudo modprobe coretemp

# Check BIOS settings (enable HW monitoring)
Issue 2: IPMI Not Working
Diagnosis:
# Check if IPMI kernel module loaded
lsmod | grep ipmi

# Load manually
sudo modprobe ipmi_devintf
sudo modprobe ipmi_si
Solutions:
- Enable IPMI in BIOS
- Check BMC firmware version
- Reset BMC from BIOS
Issue 3: High Temperature Despite Low Load
Diagnosis:
# Check thermal paste age
sensors

# Check fan operation
sensors | grep fan

# Check dust accumulation
sudo ipmitool sensor | grep -i fan
Solutions:
- Clean dust from heatsinks
- Replace thermal paste
- Verify fan operation
- Check ambient temperature
Issue 4: NVMe Not Detected
# Check if NVMe module loaded
lsmod | grep nvme

# Load module
sudo modprobe nvme

# List PCIe devices
lspci | grep -i nvme
Automated Monitoring Scripts
Daily Health Check Script
Cron Job Setup
# Edit crontab
crontab -e

# Add daily check at 2 AM
0 2 * * * /usr/local/bin/hardware-check.sh > /var/log/hardware-check.log 2>&1

# Or hourly monitoring
0 * * * * /usr/local/bin/hardware-monitor.sh
Conclusion
Hardware sensor and resource monitoring is the core of server operational stability. Early detection of temperature rises, voltage abnormalities, disk degradation, etc., can prevent failures before they occur.
The commands introduced above are easily applicable in most Linux environments, and can be visualized using Grafana + Prometheus + node_exporter if needed.
Key Points:
✅ Linux servers are more directly affected by hardware conditions than virtual environments
✅ Regular sensor checks cost nothing but prevent major failures
✅ Especially during summer or sustained high-load periods, monitor CPU throttling and fan status
Best Practices:
- Set up automated monitoring
- Define alert thresholds
- Regular maintenance schedule
- Document baseline metrics
- Test alerting system
Check your hardware before it gets too hot. Prevention is better than emergency repairs.

Comments