23 min to read
Complete Kubernetes Internal Network Analysis - Packet Flow Tracing in IPVS Mode
Deep dive into kube-proxy IPVS mode with hands-on tcpdump packet analysis
Overview
To resolve network issues in Kubernetes clusters, you must understand the internal network architecture accurately. When identical problems occur across different environments like on-premises and AWS clusters, packet analysis using tcpdump becomes essential.
This guide provides a detailed examination of Kubernetes network internals and packet flow tracing methods using tcpdump in environments running kube-proxy IPVS mode. Through hands-on lab exercises, you’ll learn to apply theoretical concepts to real-world troubleshooting scenarios.
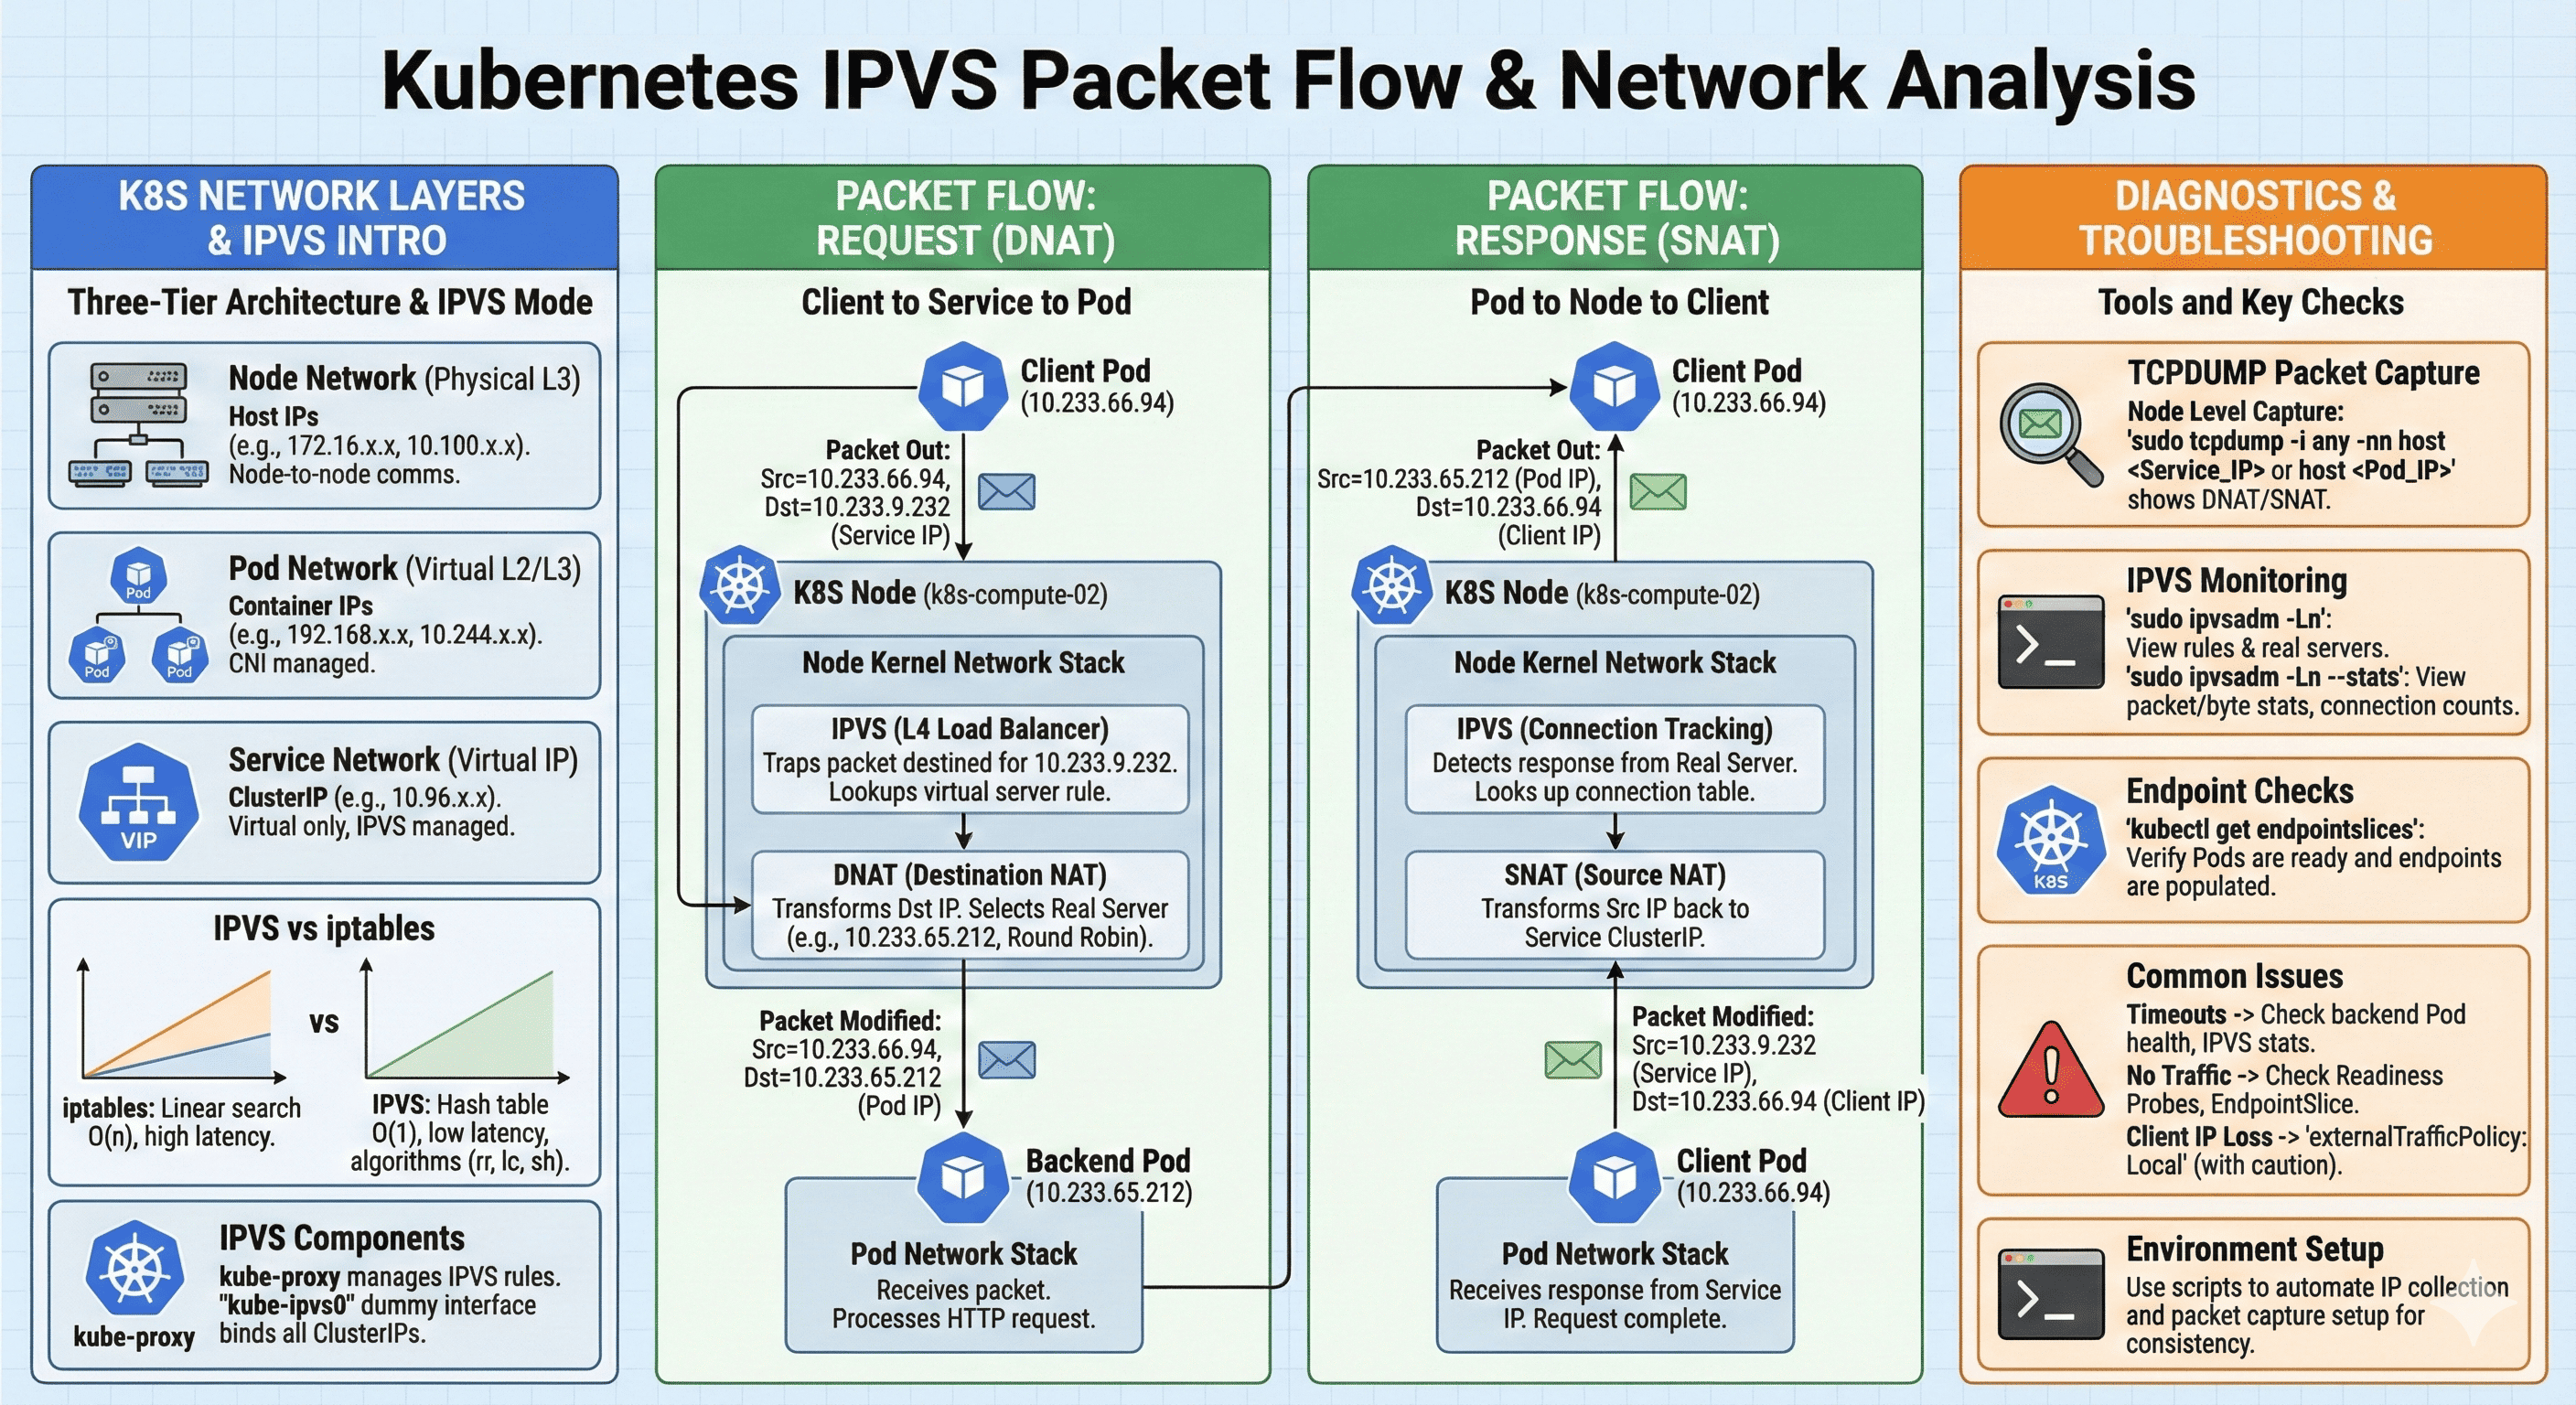
Kubernetes Network Layer Architecture
Kubernetes networking consists of three primary layers, each serving distinct purposes in the overall communication architecture.
10.100.1.10] Node2[Node 2
10.100.1.11] Node3[Node 3
10.100.1.12] end subgraph "Pod Network (CNI Managed)" Pod1[Pod A
192.168.1.10] Pod2[Pod B
192.168.1.11] Pod3[Pod C
192.168.2.10] end subgraph "Service Network (Virtual)" SVC[ClusterIP
10.96.100.50] end SVC --> Pod1 SVC --> Pod2 SVC --> Pod3 Node1 --> Pod1 Node1 --> Pod2 Node2 --> Pod3 end
Node Network (Physical Network)
The Node Network handles actual physical communication between cluster nodes. On-premises environments typically use address ranges like 10.0.0.0/8 or 172.16.0.0/12, while AWS uses VPC CIDR ranges such as 10.100.0.0/16. Each node receives a unique IP address for inter-node communication.
Pod Network (Container Network)
The Pod Network is a virtual network range assigned to Pods. CNI plugins (Calico, Flannel, AWS VPC CNI, Cilium, etc.) manage this network, typically using ranges like 192.168.0.0/16 or 10.244.0.0/16. Each Pod receives a unique IP from this range.
Service Network (Virtual Network)
The Service Network is a completely virtual IP range assigned to Service resources. It uses the 10.96.0.0/12 range by default and doesn’t exist on actual network interfaces. kube-proxy manages this through iptables or IPVS rules. ClusterIPs are allocated from this range.
IPVS vs iptables Mode
Understanding the differences between IPVS and iptables modes is crucial for optimizing Kubernetes networking performance at scale.
IPVS provides significant advantages in large clusters where iptables rule processing becomes a bottleneck.
Limitations of iptables Mode
iptables mode manages all Services and Endpoints through iptables rules. If you have 10 Services with 3 Pods each, over 30 iptables rules are created. The problem is that iptables rule processing uses linear search. With 1000 rules, an average of 500 rules must be checked, increasing latency. In large-scale clusters, tens of thousands of rules can be generated, causing severe performance degradation.
Advantages of IPVS Mode
IPVS is a Linux kernel L4 load balancing technology that uses hash tables for O(1) time complexity lookups. Whether you have 10 or 10,000 rules, lookup speed remains nearly identical.
IPVS also supports various load balancing algorithms:
- Round Robin (rr): Distributes requests sequentially
- Least Connection (lc): Routes to backend with fewest connections
- Source Hashing (sh): Enables session persistence based on client IP
Verifying IPVS Mode
To check if your cluster uses IPVS mode, query the kube-proxy ConfigMap:
kubectl get cm kube-proxy -n kube-system -o yaml | grep mode -A6
    mode: ipvs
    nftables:
      masqueradeAll: false
      masqueradeBit: null
      minSyncPeriod: 0s
      syncPeriod: 0s
    nodePortAddresses: []
Alternatively, SSH into a node and directly check IPVS rules:
ipvsadm -Ln
IPVS Internal Operation
Virtual Server Creation
When a Service is created, kube-proxy registers the ClusterIP as a virtual server. For example, if nginx-service has ClusterIP 10.96.100.50 on port 80, IPVS creates “10.96.100.50:80” as a virtual server.
Real Server Registration
Each Pod IP registered as a Service Endpoint becomes a Real Server. If nginx has 3 Pods with IPs 192.168.1.10, 192.168.1.11, and 192.168.1.12, all three are registered as Real Servers for load balancing.
Packet Forwarding Mechanism
When a client sends a request to the ClusterIP, IPVS intercepts it and performs DNAT to the selected Real Server IP. For response packets, it performs SNAT so the client appears to receive responses from the ClusterIP.
The kube-ipvs0 Interface
In IPVS mode, a dummy interface called kube-ipvs0 is created, and all ClusterIPs are bound to this interface. This enables local routing by making the kernel recognize these IPs as local addresses.
ip addr show kube-ipvs0
5: kube-ipvs0: <BROADCAST,NOARP> mtu 1500 qdisc noop state DOWN group default
    link/ether 86:54:48:7a:c7:9f brd ff:ff:ff:ff:ff:ff
    inet 10.233.48.215/32 scope global kube-ipvs0
       valid_lft forever preferred_lft forever
    inet 10.10.10.55/32 scope global kube-ipvs0
       valid_lft forever preferred_lft forever
    inet 10.233.49.249/32 scope global kube-ipvs0
       valid_lft forever preferred_lft forever
You can verify which Service owns a specific ClusterIP:
kubectl get svc --all-namespaces | grep 10.233.48.215
NAMESPACE       NAME                        TYPE           CLUSTER-IP      EXTERNAL-IP   PORT(S)
ingress-nginx   ingress-nginx-controller    LoadBalancer   10.233.48.215   10.10.10.55   80:30860/TCP,443:32200/TCP
Lab Environment Setup
Step 1: Create Test Namespace
First, create an isolated test environment with a dedicated namespace:
kubectl create namespace network-test
Step 2: Gather Cluster Network Information
Before starting the lab, identify your cluster’s network configuration.
Pod CIDR:
kubectl cluster-info dump | grep -m 1 cluster-cidr
Or:
10.233.64.0/24
10.233.65.0/24
10.233.66.0/24
10.233.67.0/24
Service CIDR:
kubectl cluster-info dump | grep -m 1 service-cluster-ip-range
"--service-cluster-ip-range=10.233.0.0/18"
CNI Plugin:
kubectl get pods -n kube-system -o wide | grep -E "calico|flannel|aws-node|cilium|weave"
Step 3: Deploy Backend Application
Create a simple nginx Deployment:
kubectl create deployment nginx --image=nginx:latest --replicas=3 -n network-test
Verify Pod status:
kubectl get pods -n network-test -o wide
NAME                     READY   STATUS    RESTARTS   AGE   IP              NODE
nginx-54c98b4f84-ftvlg   1/1     Running   0          33s   10.233.66.111   k8s-compute-02
nginx-54c98b4f84-tgmgh   1/1     Running   0          33s   10.233.65.212   k8s-compute-01
nginx-54c98b4f84-vzgjc   1/1     Running   0          33s   10.233.67.86    k8s-compute-03
Note each Pod’s IP address and running node.
Step 4: Create Service
Create a ClusterIP Service to expose the Pods:
kubectl expose deployment nginx --port=80 --target-port=80 --name=nginx-service -n network-test
Verify Service information:
kubectl get svc nginx-service -n network-test
NAME            TYPE        CLUSTER-IP     EXTERNAL-IP   PORT(S)   AGE
nginx-service   ClusterIP   10.233.9.232   <none>        80/TCP    16s
Note the ClusterIP address (10.233.9.232 in this example).
Step 5: Check Endpoints
Using EndpointSlice (Kubernetes 1.21+):
kubectl get endpointslices -n network-test
NAME                  ADDRESSTYPE   PORTS   ENDPOINTS                                        AGE
nginx-service-9jrhc   IPv4          80      10.233.65.212,10.233.66.111,10.233.67.86        2m
For detailed information:
kubectl describe endpointslices -n network-test
Name:         nginx-service-9jrhc
Namespace:    network-test
Labels:       app=nginx
              kubernetes.io/service-name=nginx-service
AddressType:  IPv4
Ports:
  Name     Port  Protocol
  ----     ----  --------
  <unset>  80    TCP
Endpoints:
  - Addresses:  10.233.67.86
    Conditions:
      Ready:    true
    TargetRef:  Pod/nginx-54c98b4f84-vzgjc
    NodeName:   k8s-compute-03
  - Addresses:  10.233.66.111
    Conditions:
      Ready:    true
    TargetRef:  Pod/nginx-54c98b4f84-ftvlg
    NodeName:   k8s-compute-02
  - Addresses:  10.233.65.212
    Conditions:
      Ready:    true
    TargetRef:  Pod/nginx-54c98b4f84-tgmgh
    NodeName:   k8s-compute-01
Step 6: Create Client Pod
Create a client Pod with network debugging tools:
kubectl run client-pod --image=nicolaka/netshoot -n network-test --command -- sleep infinity
Wait for the Pod to be ready:
kubectl wait --for=condition=ready pod/client-pod --timeout=60s -n network-test
Verify client Pod information:
kubectl get pod client-pod -o wide -n network-test
NAME         READY   STATUS    RESTARTS   AGE   IP             NODE
client-pod   1/1     Running   0          43s   10.233.66.94   k8s-compute-02
Step 7: Environment Information Script
Create a script to automatically gather environment information:
cat << 'EOF' > network-test-info.sh
#!/bin/bash

NAMESPACE="network-test"

echo "======================================"
echo "  Kubernetes Network Test Environment"
echo "======================================"
echo ""

# Service IP
SERVICE_IP=$(kubectl get svc nginx-service -n $NAMESPACE -o jsonpath='{.spec.clusterIP}')
echo "Service ClusterIP: $SERVICE_IP"
echo ""

# Client Pod IP
CLIENT_IP=$(kubectl get pod client-pod -n $NAMESPACE -o jsonpath='{.status.podIP}' 2>/dev/null)
CLIENT_NODE=$(kubectl get pod client-pod -n $NAMESPACE -o jsonpath='{.spec.nodeName}' 2>/dev/null)
echo "Client Pod:"
echo "  IP: $CLIENT_IP"
echo "  Node: $CLIENT_NODE"
echo ""

# Backend Pod IPs
echo "Backend Pods:"
kubectl get pods -n $NAMESPACE -l app=nginx -o custom-columns=NAME:.metadata.name,IP:.status.podIP,NODE:.spec.nodeName --no-headers | while read name ip node; do
    echo "  $name"
    echo "    IP: $ip"
    echo "    Node: $node"
done
echo ""

# Endpoints
echo "Endpoints:"
ENDPOINTS=$(kubectl get endpoints nginx-service -n $NAMESPACE -o jsonpath='{.subsets[0].addresses[*].ip}' 2>/dev/null)
echo "  $ENDPOINTS"
echo ""

# First backend IP
BACKEND_IP=$(echo $ENDPOINTS | awk '{print $1}')

echo "======================================"
echo "  Useful Commands"
echo "======================================"
echo ""
echo "# Export variables:"
echo "export SERVICE_IP=$SERVICE_IP"
echo "export CLIENT_IP=$CLIENT_IP"
echo "export BACKEND_IP=$BACKEND_IP"
echo ""

EOF

chmod +x network-test-info.sh
Run the script:
./network-test-info.sh
======================================
  Kubernetes Network Test Environment
======================================

Service ClusterIP: 10.233.9.232

Client Pod:
  IP: 10.233.66.94
  Node: k8s-compute-02

Backend Pods:
  nginx-54c98b4f84-ftvlg
    IP: 10.233.66.111
    Node: k8s-compute-02
  nginx-54c98b4f84-tgmgh
    IP: 10.233.65.212
    Node: k8s-compute-01
  nginx-54c98b4f84-vzgjc
    IP: 10.233.67.86
    Node: k8s-compute-03

Endpoints:
  10.233.65.212 10.233.66.111 10.233.67.86

======================================
  Useful Commands
======================================

# Export variables:
export SERVICE_IP=10.233.9.232
export CLIENT_IP=10.233.66.94
export BACKEND_IP=10.233.65.212
Set the environment variables:
export SERVICE_IP=10.233.9.232
export CLIENT_IP=10.233.66.94
export BACKEND_IP=10.233.65.212
Step 8: Basic Connectivity Test
Test basic connectivity from client Pod to Service:
kubectl exec -it client-pod -n network-test -- curl -s http://nginx-service
Run multiple requests to verify load balancing:
kubectl exec -it client-pod -n network-test -- bash -c "for i in {1..10}; do curl -s http://nginx-service | grep title; done"
<title>Welcome to nginx!</title>
<title>Welcome to nginx!</title>
<title>Welcome to nginx!</title>
...
IPVS Rule Analysis
Step 1: Access Node and Check IPVS Rules
SSH into the node where the client Pod is running:
# Check client node
kubectl get pod client-pod -n network-test -o jsonpath='{.spec.nodeName}'
# Output: k8s-compute-02

# SSH to node
ssh k8s-compute-02
Check IPVS rules for the nginx-service:
sudo ipvsadm -Ln | grep -A 5 "10.233.9.232"
TCP  10.233.9.232:80 rr
  -> 10.233.65.212:80             Masq    1      0          0
  -> 10.233.66.111:80             Masq    1      0          0
  -> 10.233.67.86:80              Masq    1      0          0
Key information:
- TCP 10.233.9.232:80: Virtual server address (Service ClusterIP)
- rr: Round Robin scheduler algorithm
- → 10.233.65.212:80: Real Server (backend Pod IP)
- Masq: Masquerade mode (NAT enabled)
- Numbers: Weight, ActiveConn, InActConn values
Step 2: Verify kube-ipvs0 Interface
Confirm the ClusterIP is bound to kube-ipvs0:
ip addr show kube-ipvs0 | grep 10.233.9.232
inet 10.233.9.232/32 scope global kube-ipvs0
Step 3: Check Routing Table
Verify routes to Pod IPs:
ip route get 10.233.65.212
# Cilium example
10.233.65.212 dev cilium_host src 10.233.66.207 uid 1000
    cache mtu 1450
Check the complete routing table for Pod networks:
ip route show | grep 10.233
10.233.64.0/24 via 10.233.66.207 dev cilium_host proto kernel src 10.233.66.207 mtu 1450
10.233.65.0/24 via 10.233.66.207 dev cilium_host proto kernel src 10.233.66.207 mtu 1450
10.233.66.0/24 via 10.233.66.207 dev cilium_host proto kernel src 10.233.66.207
10.233.67.0/24 via 10.233.66.207 dev cilium_host proto kernel src 10.233.66.207 mtu 1450
Packet Flow Analysis Lab
Preparation: Configure Unique Backend Responses
To identify which backend Pod responds, set unique responses on each Pod:
# Get Pod list
PODS=$(kubectl get pods -n network-test -l app=nginx -o jsonpath='{.items[*].metadata.name}')

# Set unique response for each Pod
i=1
for pod in $PODS; do
    kubectl exec $pod -n network-test -- sh -c 'echo "Backend POD-'$i': $(hostname)" > /usr/share/nginx/html/index.html'
    ((i++))
done
Test the responses:
kubectl exec -it client-pod -n network-test -- bash -c "for i in {1..12}; do curl -s http://nginx-service; done"
Backend POD-2: nginx-54c98b4f84-tgmgh
Backend POD-2: nginx-54c98b4f84-tgmgh
Backend POD-3: nginx-54c98b4f84-vzgjc
Backend POD-1: nginx-54c98b4f84-ftvlg
Backend POD-2: nginx-54c98b4f84-tgmgh
...
Round Robin distribution is visible across the backends.
Packet Capture Setup
Prepare four terminals:
- Terminal 1: Client Pod internal packet capture
- Terminal 2: Node packet capture
- Terminal 3: Backend Pod internal packet capture
- Terminal 4: Traffic generation
Set environment variables in each terminal:
export SERVICE_IP=10.233.9.232
export CLIENT_IP=10.233.66.94
export BACKEND_IP=10.233.65.212
Terminal 1: Client Pod Packet Capture
kubectl exec -it client-pod -n network-test -- tcpdump -i any -nn -v "host $SERVICE_IP or host $BACKEND_IP" -w /tmp/client.pcap
Terminal 2: Node Packet Capture
SSH into the client Pod’s node:
sudo tcpdump -i any -nn -v "host $SERVICE_IP or host $BACKEND_IP" -w /tmp/node.pcap
Terminal 3: Backend Pod Packet Capture
Access one of the backend Pods:
BACKEND_POD=$(kubectl get pods -n network-test -l app=nginx -o jsonpath='{.items[0].metadata.name}')
kubectl exec -it $BACKEND_POD -n network-test -- bash
Install tcpdump in the nginx container:
apt-get update && apt-get install -y tcpdump
Start capture:
tcpdump -i any -nn -v port 80 -w /tmp/backend.pcap
Terminal 4: Generate Traffic
kubectl exec -it client-pod -n network-test -- bash
Generate requests:
for i in {1..20}; do
  echo "Request $i:"
  curl -s http://nginx-service
  sleep 0.5
done
Capture File Analysis
Copy Files Locally
# From client Pod
kubectl cp network-test/client-pod:/tmp/client.pcap ./client.pcap

# From node (using scp)
scp k8s-compute-02:/tmp/node.pcap ./node.pcap

# From backend Pod
kubectl cp network-test/$BACKEND_POD:/tmp/backend.pcap ./backend.pcap
Client Perspective Analysis
tcpdump -r client.pcap -nn -v | head -n 50
10.233.66.94.43856 > 10.233.9.232.80: Flags [S]           # SYN: Connection start
10.233.9.232.80 > 10.233.66.94.43856: Flags [S.]          # SYN-ACK: Server response
10.233.66.94.43856 > 10.233.9.232.80: Flags [.]           # ACK: 3-way handshake complete
10.233.66.94.43856 > 10.233.9.232.80: Flags [P.]          # HTTP GET request
    GET / HTTP/1.1
    Host: nginx-service

10.233.9.232.80 > 10.233.66.94.43856: Flags [P.]          # HTTP 200 OK response
    HTTP/1.1 200 OK
    Server: nginx/1.29.3
Key observations:
- Client Pod IP: 10.233.66.94
- Service ClusterIP: 10.233.9.232 (Port 80)
- The client only sees communication with the Service ClusterIP
- Actual backend Pod IPs are completely invisible
- This is the core of Service abstraction
Node Perspective Analysis
tcpdump -r node.pcap -nn -v | head -n 100
Critical insight: The same packet appears twice - before and after IP translation!
Request Packet (SYN):
# Before DNAT - arrives with Service IP
12:15:36.180603 In  10.233.66.94.34376 > 10.233.9.232.80: Flags [S]

# After DNAT - transformed to actual Pod IP
12:15:36.180621 Out 10.233.66.94.34376 > 10.233.65.212.80: Flags [S]
IPVS transforms the destination IP:
- 10.233.9.232 (Service ClusterIP) → 10.233.65.212 (actual backend Pod)
Response Packet (SYN-ACK):
# Before SNAT - response from actual Pod
12:15:36.180869 P   10.233.65.212.80 > 10.233.66.94.34376: Flags [S.]

# After SNAT - transformed to Service IP
12:15:36.180901 Out 10.233.9.232.80 > 10.233.66.94.34376: Flags [S.]
IPVS transforms the source IP:
- 10.233.65.212 (actual backend Pod) → 10.233.9.232 (Service ClusterIP)
Backend Perspective Analysis
tcpdump -r backend.pcap -nn -v | head -n 50
Critical insight: Service IP (10.233.9.232) never appears!
# Request received - from client's actual IP
12:09:49.898326 In  10.233.66.94.43874 > 10.233.66.111.80: Flags [S]

# Response sent - to client's actual IP
12:09:49.898345 Out 10.233.66.111.80 > 10.233.66.94.43874: Flags [S.]

# HTTP request received
12:09:49.898428 In  10.233.66.94.43874 > 10.233.66.111.80: Flags [P.]
    GET / HTTP/1.1
    Host: nginx-service
From the backend’s perspective:
- Client IP: 10.233.66.94
- Backend’s own IP: 10.233.66.111
- Service IP (10.233.9.232) is completely unknown
- IPVS’s existence is invisible
Three-Perspective Comparison Summary
| Perspective | Source IP | Destination IP | Characteristic |
|---|---|---|---|
| Client | 10.233.66.94 | 10.233.9.232 (Service) | Only knows Service IP |
| Node (Pre-DNAT) | 10.233.66.94 | 10.233.9.232 (Service) | IPVS intercepts |
| Node (Post-DNAT) | 10.233.66.94 | 10.233.65.212 (Pod) | Translated to actual Pod IP |
| Backend | 10.233.66.94 | 10.233.66.111 (self) | Appears as direct communication |
Response packets (reverse direction):
| Perspective | Source IP | Destination IP | Characteristic |
|---|---|---|---|
| Backend | 10.233.66.111 (self) | 10.233.66.94 | Direct response to client |
| Node (Pre-SNAT) | 10.233.65.212 (Pod) | 10.233.66.94 | IPVS intercepts |
| Node (Post-SNAT) | 10.233.9.232 (Service) | 10.233.66.94 | Disguised as Service IP |
| Client | 10.233.9.232 (Service) | 10.233.66.94 | Appears from Service |
IPVS Processing Summary
The client believes it's communicating only with the Service.
The backend believes it's communicating directly with the client.
Neither knows IPVS exists = Perfect abstraction!
What Happens on the Node
- Incoming packet detection - Is destination = Service IP? → IPVS intervenes!
- Hash table lookup - 10.233.9.232:80 → Virtual server found
- Real Server selection - Round Robin: Choose from 10.233.65.212, 10.233.66.111, 10.233.67.86
- DNAT execution - Destination IP transform: 10.233.9.232 → 10.233.65.212
- Connection tracking record - Store for response packet processing
- Response packet detection - Is source = selected Real Server? → Check connection table
- SNAT execution - Source IP transform: 10.233.65.212 → 10.233.9.232
Real-Time Statistics Monitoring
Terminal 1: Statistics Monitoring
On the node:
ssh k8s-compute-02
watch -n 1 "sudo ipvsadm -Ln --stats | grep -A 5 '10.233.9.232'"
Terminal 2: Generate Traffic
kubectl exec -it client-pod -n network-test -- bash -c "for i in {1..50}; do curl -s http://nginx-service > /dev/null; sleep 0.2; done"
Watch the Conns, InPkts, and OutPkts values increase in real-time:
TCP  10.233.9.232:80 rr
  -> 10.233.65.212:80             Masq    15     450        445
  -> 10.233.66.111:80             Masq    16     480        475
  -> 10.233.67.86:80              Masq    14     420        415
Traffic is distributed nearly equally across the three Real Servers.
Detailed Rate Statistics
sudo ipvsadm -Ln --rate | grep -A 5 "10.233.9.232"
TCP  10.233.9.232:80 rr
  -> 10.233.65.212:80             5      150    145    12K    120K
  -> 10.233.66.111:80             5      148    143    12K    118K
  -> 10.233.67.86:80              5      152    147    13K    122K
Shows CPS (connections/sec), InPPS, OutPPS, InBPS, OutBPS.
Note: In Cilium CNI environments, IPVS statistics may show as 0 because Cilium eBPF processes packets at the socket level first.
Troubleshooting Command Reference
Connection Problem Diagnosis
# Service to Pod connectivity check
kubectl exec -it client-pod -n network-test -- curl -v --connect-timeout 5 http://nginx-service

# DNS resolution check
kubectl exec -it client-pod -n network-test -- nslookup nginx-service

# Direct Service IP connection test
kubectl exec -it client-pod -n network-test -- curl -v --connect-timeout 5 http://$SERVICE_IP
IPVS Status Inspection
# Full IPVS rules
sudo ipvsadm -Ln

# Connection state for specific Service
sudo ipvsadm -Lnc | grep $SERVICE_IP

# IPVS kernel module check
lsmod | grep ip_vs

# conntrack table (NAT tracking)
sudo conntrack -L -d $SERVICE_IP 2>/dev/null | head -20
Real-Time Packet Analysis
# Capture only SYN packets (connection attempts)
sudo tcpdump -i any -nn "tcp[tcpflags] & tcp-syn != 0" and host $SERVICE_IP

# Capture RST packets (connection rejections)
sudo tcpdump -i any -nn "tcp[tcpflags] & tcp-rst != 0" and host $SERVICE_IP

# Check for retransmissions (network delay/loss detection)
sudo tcpdump -i any -nn "tcp[tcpflags] & tcp-syn != 0" and host $SERVICE_IP -v | grep -i retrans
Endpoint Status Check
# EndpointSlice status (Ready state)
kubectl get endpointslices -n network-test -o wide

# Backend Pod status for specific Service
kubectl get pods -n network-test -l app=nginx -o custom-columns=NAME:.metadata.name,STATUS:.status.phase,IP:.status.podIP,NODE:.spec.nodeName,READY:.status.conditions[?(@.type=="Ready")].status
Common Problems and Solutions
Problem 1: Intermittent Service Connection Timeouts
Symptom: curl requests occasionally timeout
Diagnosis:
# Check backend Pod status
kubectl get pods -n network-test -l app=nginx

# Check IPVS for specific Real Server connection failures
sudo ipvsadm -Ln --stats | grep -A 5 $SERVICE_IP
Solution: If InActConn is abnormally high for a specific Real Server, inspect that Pod’s health.
Problem 2: New Pods Not Receiving Traffic
Symptom: Pod is Running but not receiving traffic
Diagnosis:
# Check if Pod is registered in EndpointSlice
kubectl describe endpointslices -n network-test | grep -A 2 "Addresses"

# Check IPVS Real Server list
sudo ipvsadm -Ln | grep -A 10 $SERVICE_IP
Solution: Verify the Pod’s Readiness Probe passes and kube-proxy is functioning normally.
Problem 3: Client IP Not Preserved
Symptom: Backend sees node IP instead of original client IP
Cause: SNAT (Masquerade) transforms the source IP
Solution:
# Set externalTrafficPolicy to Local (NodePort/LoadBalancer types)
kubectl patch svc nginx-service -n network-test -p '{"spec":{"externalTrafficPolicy":"Local"}}'
Warning: Local mode may drop traffic if no Pods exist on that node.
Lab Environment Cleanup
After completing the lab, clean up created resources:
# Delete entire test namespace (removes all internal resources)
kubectl delete namespace network-test

# Clean up local files
rm -f client.pcap node.pcap backend.pcap network-test-info.sh

# Clean up capture files on node (after SSH)
ssh k8s-compute-02 'sudo rm -f /tmp/*.pcap'
Verify deletion:
kubectl get all -n network-test
# Output: No resources found in network-test namespace.
Conclusion
This guide covered Kubernetes IPVS mode network internals and packet analysis methods using tcpdump.
Key Takeaways
IPVS’s Role
- Registers Service ClusterIP as virtual server and manages Pod IPs as Real Servers
- Hash table-based O(1) lookups maintain consistent performance in large-scale clusters
- DNAT/SNAT provides transparent load balancing to both clients and backends
Packet Flow Essentials:
- Clients communicate only with Service IP without knowing actual backends
- IPVS at the node intercepts packets and transforms destination IP to actual Pod IP (DNAT)
- Response packets have source IP transformed back to Service IP (SNAT)
- Backends appear to communicate directly with clients
Analysis Points:
- Node-level packet capture reveals both pre and post DNAT/SNAT
- ipvsadm provides real-time statistics and connection state monitoring
- Analyzing from three perspectives (client, node, backend) simultaneously enables effective root cause identification
With this understanding, you can systematically analyze and resolve Kubernetes network issues across both on-premises and cloud environments.

Comments