16 min to read
Kubernetes OOMKilled Response Strategy - Stop Just Increasing Memory!
Systematic approaches to diagnose, optimize, and prevent Out of Memory errors in production clusters
Overview
If you’ve been operating Kubernetes for any length of time, you’ve inevitably encountered a familiar situation: the dreaded OOMKilled (Out of Memory Killed) error. This occurs when a Pod exceeds its configured memory limit and gets forcefully terminated by the kernel. It’s a headache-inducing problem for many DevOps engineers.
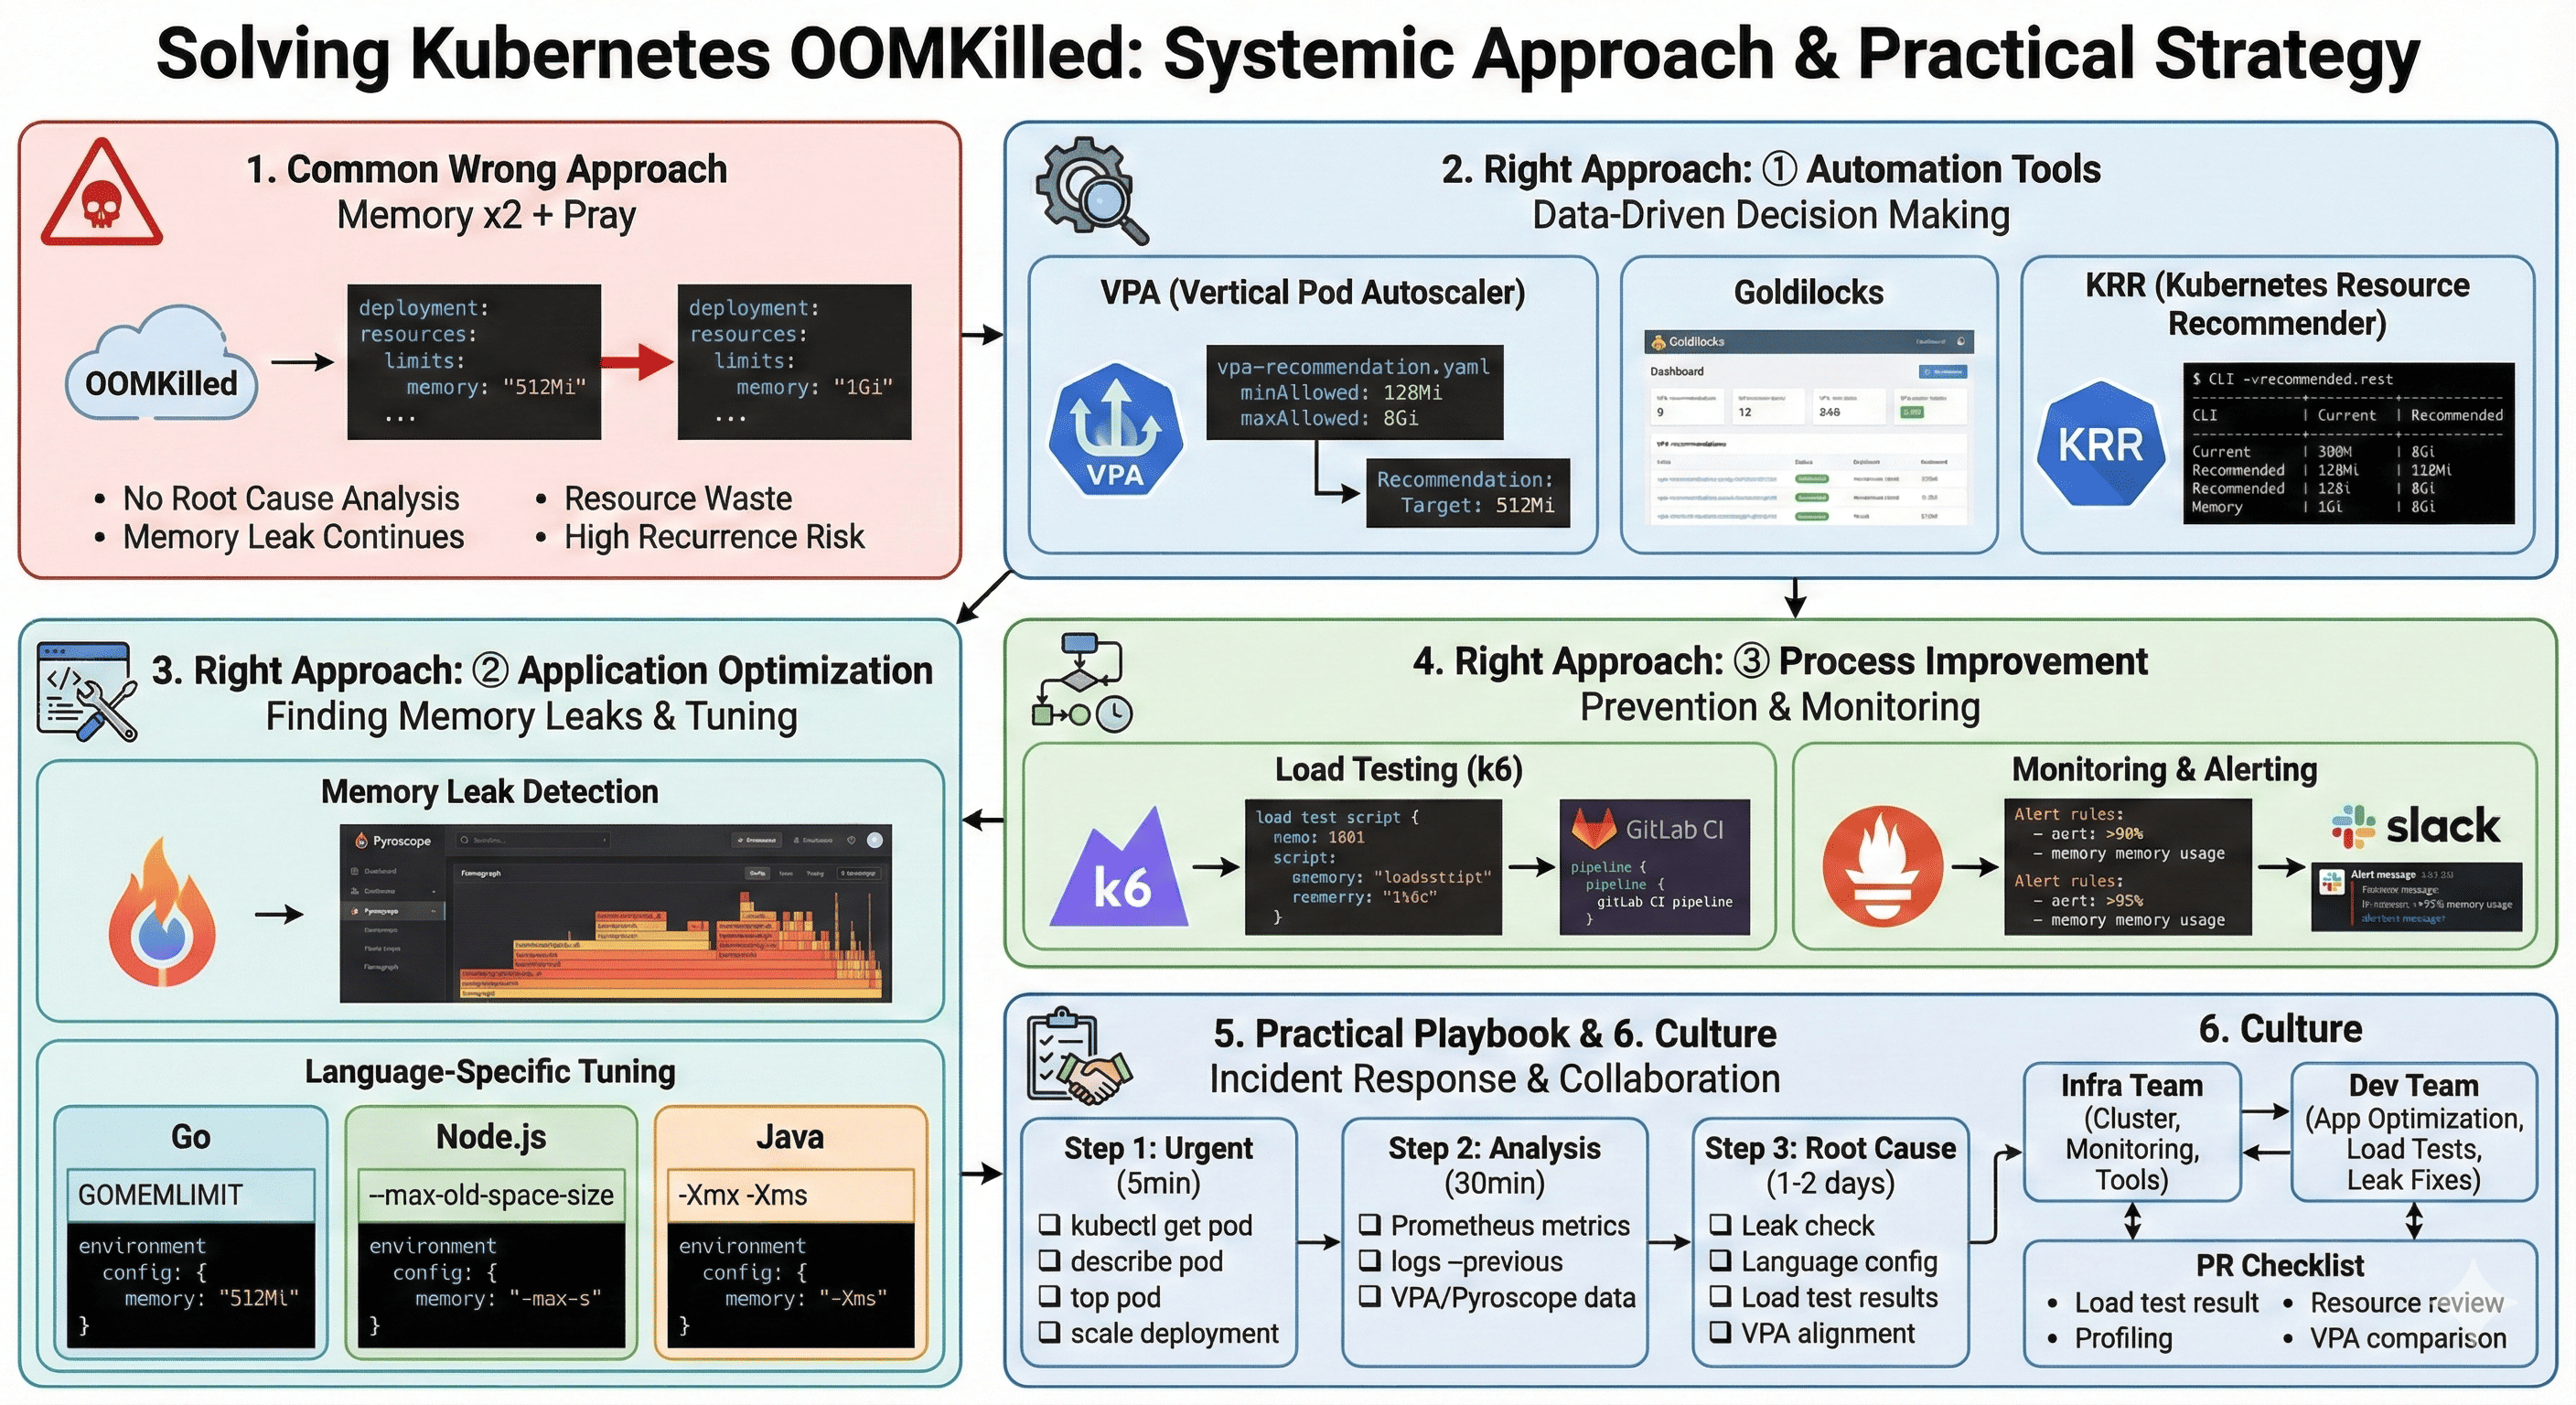
How do most teams handle this issue? The common knee-jerk reaction is “let’s just double the memory and redeploy.” However, this is not a fundamental solution and leads to resource waste and increased costs.
This guide covers systematic approaches to OOMKilled problems with solutions you can immediately apply in production environments. The goal isn’t simply to increase resources, but to understand why the error occurred, calculate appropriate resource allocations, and establish processes to prevent recurrence.
The Problem with Common Response Patterns
The “Double Memory + Hope” Anti-Pattern
When OOMKilled occurs, many teams respond like this:
# Before
resources:
  limits:
    memory: "512Mi"

# After (post-error)
resources:
  limits:
    memory: "1Gi"  # Just doubled it
Why This Approach Fails
The problems with this approach include:
- Fails to identify root cause - You don’t know why it happened
- Memory leaks persist - If there’s a memory leak, OOM will recur eventually
- Resource waste - Cluster costs increase unnecessarily
- High recurrence probability - The underlying issue remains unresolved
Why Teams Default to This Pattern
| Factor | Description | Impact |
|---|---|---|
| Lack of Visibility | Teams don't know actual memory usage patterns | Blind guessing on resource allocation |
| Time Pressure | Production incidents require immediate action | Quick fixes over proper solutions |
| Unclear Ownership | Responsibility unclear between Dev and Ops | No one investigates root cause |
| Missing Tools | No methodology for calculating optimal resources | Arbitrary resource allocation |
The Right Approach: Part 1 - Automation Tools
VPA (Vertical Pod Autoscaler) - Recommendation Mode
VPA can be run in “Recommendation Only” mode to receive optimal resource suggestions based on actual usage patterns.
Installation and Setup
# Install VPA
git clone https://github.com/kubernetes/autoscaler.git
cd autoscaler/vertical-pod-autoscaler
./hack/vpa-up.sh
VPA Resource Configuration
# vpa-recommendation.yaml
apiVersion: autoscaling.k8s.io/v1
kind: VerticalPodAutoscaler
metadata:
  name: my-app-vpa
spec:
  targetRef:
    apiVersion: "apps/v1"
    kind: Deployment
    name: my-app
  updatePolicy:
    updateMode: "Off"  # Recommend only, no auto-apply
  resourcePolicy:
    containerPolicies:
    - containerName: "*"
      minAllowed:
        memory: "128Mi"
      maxAllowed:
        memory: "8Gi"
Checking Recommendations
kubectl describe vpa my-app-vpa

# Example output
Recommendation:
  Container Recommendations:
    Container Name:  my-app
    Lower Bound:
      Memory:  256Mi
    Target:
      Memory:  512Mi    # Recommended value
    Uncapped Target:
      Memory:  512Mi
    Upper Bound:
      Memory:  1Gi
VPA Best Practices
| Practice | Recommendation | Rationale |
|---|---|---|
| Data Collection Period | Minimum 2 weeks to 1 month | Captures various workload patterns |
| Peak Time Consideration | Include peak traffic periods | Prevents OOM during high load |
| Buffer Addition | Add 20-30% to recommended values | Safety margin for unexpected spikes |
| Update Mode | Start with "Off" mode | Review before applying changes |
Goldilocks - VPA Visualization Dashboard
Goldilocks is a tool that displays VPA recommendations in a dashboard format, similar to Grafana.
Installation
# Install with Helm
helm repo add fairwinds-stable https://charts.fairwinds.com/stable
helm install goldilocks fairwinds-stable/goldilocks --namespace goldilocks --create-namespace
Enable Namespace Monitoring
kubectl label namespace production goldilocks.fairwinds.com/enabled=true
Access Dashboard
kubectl -n goldilocks port-forward svc/goldilocks-dashboard 8080:80
# Access http://localhost:8080
The dashboard provides a comprehensive view comparing current settings vs. recommended values for all workloads at a glance. You can also configure Ingress for permanent access.
For detailed installation instructions, refer to https://github.com/FairwindsOps/charts.
KRR (Kubernetes Resource Recommender)
KRR is a CLI tool from Robusta that analyzes Prometheus metrics to provide resource recommendations.
# Installation
pip install krr

# Execution
krr simple --prometheus-url http://prometheus:9090
# Example output
| Namespace   | Name          | Container | Current Memory | Recommended | Severity |
|-------------|---------------|-----------|----------------|-------------|----------|
| production  | payment-api   | app       | 1Gi           | 512Mi       | HIGH      |
| production  | user-service  | app       | 512Mi         | 2Gi         | CRITICAL  |
Tool Comparison Summary
| Tool | Type | Data Source | Best For |
|---|---|---|---|
| VPA | Kubernetes Native | Metrics Server | Continuous monitoring, auto-scaling |
| Goldilocks | Dashboard | VPA Recommendations | Visual comparison, team reviews |
| KRR | CLI Tool | Prometheus | Quick audits, CI/CD integration |
The Right Approach: Part 2 - Application Optimization
Detecting Memory Leaks
Simply increasing memory often doesn’t solve the problem. You need to suspect memory leaks.
Memory Leak Indicators
- Memory usage keeps increasing over time
- Normal immediately after restart, OOM after a few days
- OOM recurs even after increasing limits
Continuous Profiling Tools
Using Grafana Pyroscope
# pyroscope-deployment.yaml
apiVersion: apps/v1
kind: Deployment
metadata:
  name: my-app
spec:
  template:
    spec:
      containers:
      - name: app
        image: my-app:latest
        env:
        # Enable Pyroscope profiling
        - name: PYROSCOPE_SERVER_ADDRESS
          value: "http://pyroscope:4040"
        - name: PYROSCOPE_APPLICATION_NAME
          value: "my-app"
Pyroscope visually shows which functions consume the most memory through Flamegraphs.
Language-Specific Optimization Tips
Go Language
// Bad example - Memory leak
resp, err := http.Get(url)
// resp.Body.Close() not called!

// Good example
resp, err := http.Get(url)
if err != nil {
    return err
}
defer resp.Body.Close()  // Always call Close
# GOMEMLIMIT configuration
# Set to approximately 80% of container memory
# Add environment variable in deployment.yaml
env:
- name: GOMEMLIMIT
  value: "800MiB"  # When container limit is 1Gi
Node.js
// package.json scripts modification
{
  "scripts": {
    "start": "node --max-old-space-size=512 app.js"
  }
}
# deployment.yaml
containers:
- name: app
  resources:
    limits:
      memory: "1Gi"
  env:
  - name: NODE_OPTIONS
    value: "--max-old-space-size=768"  # 75% of container limit
Java
# deployment.yaml
containers:
- name: app
  resources:
    limits:
      memory: "2Gi"
  env:
  - name: JAVA_OPTS
    value: "-Xmx1536m -Xms512m"  # Max heap at 75% of limit
Language Runtime Memory Configuration Summary
| Language | Configuration | Recommended Value | Notes |
|---|---|---|---|
| Go | GOMEMLIMIT | 80% of container limit | Go 1.19+ required |
| Node.js | --max-old-space-size | 75% of container limit | In MB, not MiB |
| Java | -Xmx | 75% of container limit | Leave room for non-heap memory |
| Python | Resource limits via code | Application-specific | Use memory_profiler for analysis |
The Right Approach: Part 3 - Process Improvement
Prevention: Load Testing
Determine resource usage before deployment.
k6 Load Test Example
// load-test.js
import http from 'k6/http';
import { check, sleep } from 'k6';

export let options = {
  stages: [
    { duration: '2m', target: 100 },  // Ramp up to 100 VUs over 2 min
    { duration: '5m', target: 100 },  // Hold for 5 min
    { duration: '2m', target: 200 },  // Ramp up to 200 VUs over 2 min
    { duration: '5m', target: 200 },  // Hold for 5 min
  ],
};

export default function () {
  let res = http.get('http://my-app:8080/api/users');
  check(res, { 'status is 200': (r) => r.status === 200 });
  sleep(1);
}
GitLab CI/CD Integration
# .gitlab-ci.yml
performance-test:
  stage: test
  image: grafana/k6:latest
  script:
    - k6 run --out json=results.json load-test.js
    # Collect memory usage
    - kubectl top pod -l app=my-app -n staging
  artifacts:
    reports:
      performance: results.json
  only:
    - merge_requests
Monitoring and Alerting Setup
Prometheus Alert Rules
Alert Escalation Strategy
Production Response Playbook
Step 1: Emergency Response (Within 5 Minutes)
# 1. Check current status
kubectl get pod -n production | grep -E "OOMKilled|Error"

# 2. Review event logs
kubectl describe pod <pod-name> -n production | grep -A 10 "Events:"

# 3. Check memory usage
kubectl top pod <pod-name> -n production

# 4. Emergency measures (if urgent)
kubectl scale deployment <deployment-name> -n production --replicas=5
# Or temporarily increase memory limit
Step 2: Root Cause Analysis (Within 30 Minutes)
# 1. Check memory trends in Prometheus
# Query: container_memory_working_set_bytes{pod=~"my-app.*"}

# 2. Review application logs
kubectl logs <pod-name> -n production --previous  # Previous pod logs

# 3. Check VPA recommendations
kubectl describe vpa my-app-vpa

# 4. Review profiling data (Pyroscope dashboard)
Step 3: Permanent Resolution (1-2 Days)
(Check profiling results)"] C2["Language settings optimal?
(GOMEMLIMIT, XMX, etc.)"] C3["Load test results?
(Peak time usage)"] C4["VPA recommendations?
(Min 2 weeks data)"] C5["Application optimization possible?
(Unnecessary caching, large objects)"] end C1 --> |Yes| F1["Fix memory leak in code"] C1 --> |No| C2 C2 --> |No| F2["Configure runtime memory settings"] C2 --> |Yes| C3 C3 --> |Missing| F3["Run load tests"] C3 --> |Done| C4 C4 --> |Different| F4["Adjust resources per VPA"] C4 --> |Similar| C5 C5 --> |Yes| F5["Optimize application"] C5 --> |No| F6["Document and monitor"]
Checklist:
- Is there a memory leak? (Check profiling results)
- Are language-specific memory settings appropriate? (GOMEMLIMIT, XMX, etc.)
- What are the load test results? (Peak time usage)
- What does VPA recommend? (Minimum 2 weeks of data)
- Can the application be optimized? (Unnecessary caching, large objects, etc.)
Organizational Culture Improvement
Establishing Dev-Ops Collaboration
Clear Responsibility Separation
| Team | Responsibilities |
|---|---|
| Infrastructure Team | Cluster resource management, Monitoring system setup, Resource optimization tools provision |
| Development Team | Application memory optimization, Load test execution, Memory leak fixes |
| Both Teams | PR reviews, Incident response, Post-mortem analysis |
Improved PR Approval Process
## PR Checklist

- [ ] Load testing completed (attach k6 results)
- [ ] Memory usage profiling completed
- [ ] Resource request/limit values reviewed for appropriateness
- [ ] Compared with VPA recommendations (within ±20%)
Complete Response Flow Summary
Conclusion
The Kubernetes OOMKilled problem is not simply “solved by increasing memory.” It’s an engineering challenge that requires understanding application resource usage patterns, gaining visibility through appropriate tools, and collaborating with development teams to resolve root causes.
Key Takeaways
| Area | Action Items | Tools |
|---|---|---|
| Tool Utilization | Data-driven decision making | VPA, Goldilocks, KRR |
| Application Optimization | Memory leak detection, language-specific tuning | Pyroscope, language profilers |
| Process Establishment | Load testing, monitoring, alerting | k6, Prometheus, Alertmanager |
| Organizational Culture | Clear responsibilities, collaboration | PR checklists, runbooks |
Instead of blindly doubling memory and hoping for the best, I encourage you to take a systematic approach to operate stable and cost-effective Kubernetes clusters. The investment in proper tooling and processes pays dividends in reduced incidents, lower costs, and better team collaboration.

Comments