12 min to read
Diagnosing Network Issues with tcpdump - A Practical Guide to Resolving SSH Connection Delays
Master packet analysis for precise network troubleshooting and performance optimization
Overview
Recently, I encountered an issue where GitHub SSH connections were abnormally slow. Running git pull required waiting over 30 seconds before any response. While it would have been easy to dismiss this as “the network is slow,” I used tcpdump to identify the exact cause of the problem.
This guide covers everything from tcpdump basics to real-world troubleshooting scenarios, demonstrating how packet analysis transforms vague network complaints into actionable diagnostic data. Instead of guessing, you’ll learn to see exactly what’s happening on the wire.
Network issues can be frustratingly opaque without the right tools. tcpdump provides visibility into the actual packets traversing your network interfaces, revealing connection establishment problems, latency sources, and protocol-level issues that would otherwise remain invisible.
What is tcpdump?
tcpdump is a command-line tool that captures and analyzes packets passing through network interfaces in real-time.
It serves as an essential utility for network troubleshooting, security analysis, and performance optimization across Unix and Linux systems.
Why Use tcpdump?
tcpdump provides capabilities that make it indispensable for network diagnostics:
- Precise Diagnostics: Identify problems using actual packet data rather than speculation
- Real-Time Monitoring: Capture traffic at the exact moment issues occur
- Lightweight Operation: Works without GUI on servers and remote systems
- Universal Availability: Pre-installed on most Unix/Linux systems
Basic Usage
Fundamental Commands
Understanding the core tcpdump commands provides the foundation for effective network analysis.
# Capture packets on all interfaces (requires root privileges)
sudo tcpdump -i any

# Capture on a specific interface
sudo tcpdump -i eth0

# Limit capture count
sudo tcpdump -i any -c 10

# Stop capture: Ctrl+C
Filtering Techniques
Effective filtering is crucial for isolating relevant traffic from the noise of busy networks.
Host Filtering
# Filter by hostname
sudo tcpdump host github.com

# Filter by IP address
sudo tcpdump host 20.200.245.247

# Source host only
sudo tcpdump src host 192.168.1.100

# Destination host only
sudo tcpdump dst host 192.168.1.100
Port Filtering
# Specific port
sudo tcpdump port 22
sudo tcpdump port 80

# Port range
sudo tcpdump portrange 8000-9000

# Source port
sudo tcpdump src port 443
Protocol Filtering
sudo tcpdump tcp
sudo tcpdump udp
sudo tcpdump icmp
Combined Filters (BPF - Berkeley Packet Filter)
# AND condition
sudo tcpdump host github.com and port 22

# OR condition
sudo tcpdump port 80 or port 443

# NOT (exclusion)
sudo tcpdump not host 192.168.1.1

# Complex conditions
sudo tcpdump 'host github.com and (port 22 or port 443)'
Output Options
Controlling output format enables both real-time analysis and detailed post-capture examination.
# Verbose mode (increasing detail levels)
sudo tcpdump -v
sudo tcpdump -vv
sudo tcpdump -vvv  # Maximum verbosity

# Display packet contents
sudo tcpdump -X  # HEX + ASCII
sudo tcpdump -A  # ASCII only

# Human-readable timestamp format
sudo tcpdump -tttt

# Disable output line buffering (real-time display)
sudo tcpdump -l
File Operations
Saving captures enables detailed offline analysis and sharing with team members.
# Save to file (pcap format)
sudo tcpdump -w capture.pcap

# Read from file
tcpdump -r capture.pcap

# Filter while saving
sudo tcpdump -w ssh-traffic.pcap host github.com and port 22

# Rotate files at size limit (100MB per file)
sudo tcpdump -w capture.pcap -C 100

# Limit file count (keep 5 files, rotate)
sudo tcpdump -w capture.pcap -C 100 -W 5
Real-World Troubleshooting Cases
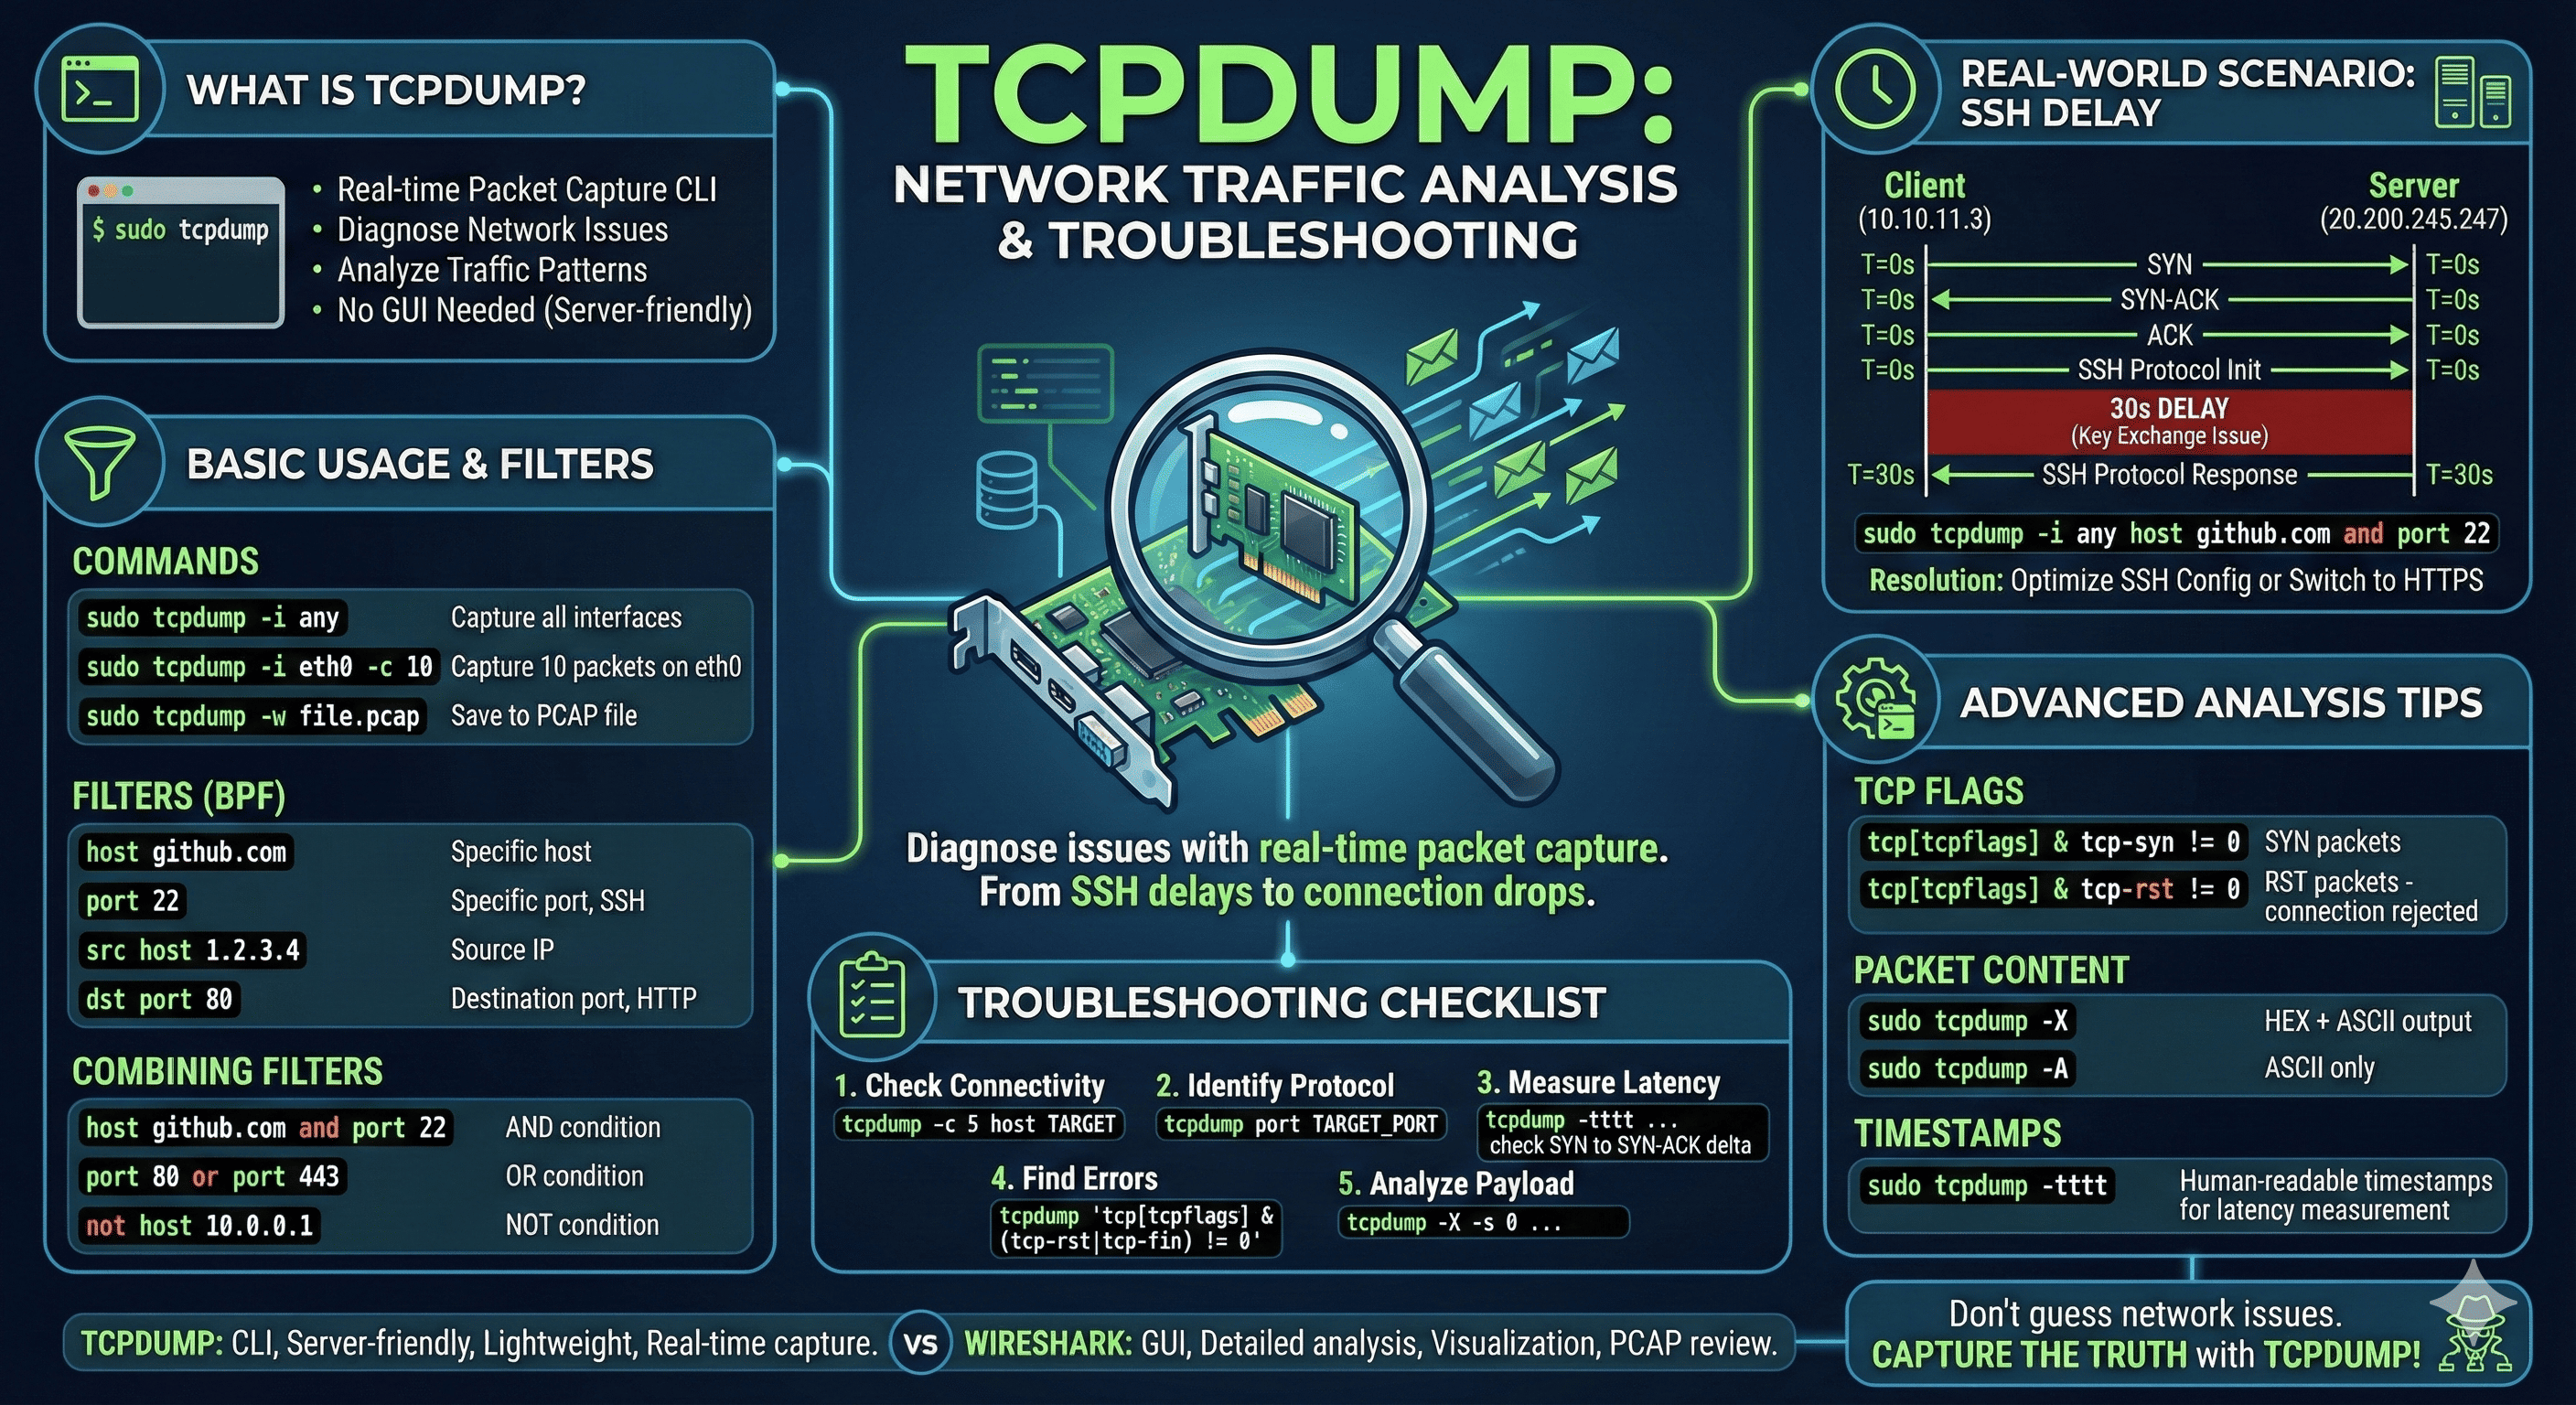
Case 1: SSH Connection Delay Diagnosis
Problem: GitHub SSH connections taking over 30 seconds
This case demonstrates how tcpdump transforms a vague “slow connection” complaint into a precise diagnosis.
Step 1: Capture While Reproducing the Problem
# Terminal 1: Run tcpdump
sudo tcpdump -i any host github.com and port 22

# Terminal 2: Attempt SSH connection
ssh -T git@github.com
Step 2: Analyze Captured Packets
Captured Log:
18:48:28.709 IP 10.10.11.3.56034 > 20.200.245.247.ssh: Flags [S], seq 2418154065
18:48:28.709 IP 10.10.11.3.56034 > 20.200.245.247.ssh: SSH: SSH-2.0-OpenSSH_9.7
18:48:58.672 IP 20.200.245.247.ssh > 10.10.11.3.56034: SSH: SSH-2.0-85ba476
Analysis Results:
- 18:48:28 - SSH version exchange initiated
- 18:48:58 - GitHub server response (30-second delay!)
- TCP connection established normally; delay occurred during SSH key exchange phase
Step 3: Resolution
# Method 1: Optimize SSH configuration
vi ~/.ssh/config
# Add: KexAlgorithms curve25519-sha256

# Method 2: Switch to HTTPS (immediate resolution)
git remote set-url origin https://github.com/user/repo.git
Case 2: Service Connection Verification
# Web server connection check
sudo tcpdump -i any 'host example.com and (port 80 or port 443)'

# DNS query verification
sudo tcpdump -i any port 53

# Database connection check
sudo tcpdump host db-server and port 3306
Case 3: TCP 3-Way Handshake Verification
Monitoring the connection establishment process reveals connectivity issues at the transport layer.
# Monitor connection establishment
sudo tcpdump -i any 'tcp[tcpflags] & (tcp-syn|tcp-ack|tcp-fin) != 0'
Normal Connection Sequence:
SYN     → Client requests connection
SYN-ACK → Server accepts
ACK     → Client confirms
Case 4: Identifying Slow Network Segments
# Capture all traffic with specific host (including timestamps)
sudo tcpdump -tttt -i any host api.example.com

# Measure response time by comparing:
# - SYN transmission time
# - SYN-ACK reception time
Advanced Techniques
TCP Flag Filtering
TCP flags reveal connection state and can identify specific types of network events.
# SYN packets only (connection attempts)
sudo tcpdump 'tcp[tcpflags] & tcp-syn != 0'

# RST packets (connection rejections)
sudo tcpdump 'tcp[tcpflags] & tcp-rst != 0'

# FIN packets (connection terminations)
sudo tcpdump 'tcp[tcpflags] & tcp-fin != 0'
| TCP Flag | Purpose | Filter Expression |
|---|---|---|
| SYN | Connection initiation | tcp[tcpflags] & tcp-syn != 0 |
| ACK | Acknowledgment | tcp[tcpflags] & tcp-ack != 0 |
| FIN | Connection termination | tcp[tcpflags] & tcp-fin != 0 |
| RST | Connection reset | tcp[tcpflags] & tcp-rst != 0 |
| PSH | Push data immediately | tcp[tcpflags] & tcp-push != 0 |
Packet Size Filtering
# Large packets only (over 1000 bytes)
sudo tcpdump 'ip[2:2] > 1000'

# Small packets only
sudo tcpdump 'ip[2:2] < 100'
Network Range Filtering
# Specific subnet
sudo tcpdump net 192.168.1.0/24

# Exclude subnet
sudo tcpdump not net 10.0.0.0/8
Simultaneous Real-Time Analysis and File Saving
# Use tee for simultaneous output
sudo tcpdump -i any -l host github.com | tee capture.log
Troubleshooting Checklist
When network issues occur, follow this systematic approach to diagnosis.
Step 1: Connection Verification
# Are packets being transmitted?
sudo tcpdump -c 10 host TARGET_HOST
Step 2: Protocol Confirmation
# Which protocol is being used?
sudo tcpdump -i any host TARGET_HOST
Step 3: Response Time Measurement
# Check SYN → SYN-ACK time difference
sudo tcpdump -tttt host TARGET_HOST and port TARGET_PORT
Step 4: Error Packet Detection
# RST, FIN and other abnormal termination packets
sudo tcpdump 'tcp[tcpflags] & (tcp-rst|tcp-fin) != 0'
Step 5: Packet Content Analysis
# Examine actual data
sudo tcpdump -X -s 0 host TARGET_HOST
tcpdump vs Wireshark
Both tools serve packet analysis needs but excel in different contexts.
| Feature | tcpdump | Wireshark |
|---|---|---|
| Interface | CLI | GUI |
| Usage Environment | Servers, Remote Systems | Desktop |
| Real-Time Analysis | ⭐⭐⭐⭐⭐ | ⭐⭐⭐ |
| Detailed Analysis | ⭐⭐⭐ | ⭐⭐⭐⭐⭐ |
| Resource Usage | Low | High |
| Protocol Decoding | Basic | Comprehensive |
Optimal Workflow: Combine Both Tools
# Capture with tcpdump
sudo tcpdump -w capture.pcap

# Analyze with Wireshark
wireshark capture.pcap
This workflow leverages tcpdump’s efficiency for capture on remote servers and Wireshark’s powerful GUI for detailed analysis.
Important Considerations
Permissions
tcpdump requires root privileges for packet capture.
# Allow specific user via sudoers
sudo visudo
# Add: username ALL=(ALL) NOPASSWD: /usr/sbin/tcpdump
Privacy and Security
Captured packets may contain sensitive information:
- Plaintext passwords (HTTP, FTP, etc.)
- Cookies and session tokens
- API keys and credentials
Warning: Exercise caution with unencrypted protocols! Always handle capture files as sensitive data and delete them after analysis.
Performance Impact
In production environments, minimize tcpdump’s footprint:
- Specify precise filters to reduce captured volume
- Minimize unnecessary packet capture
- Monitor disk space when saving to files
- Consider using ring buffer mode for long-running captures
Essential Command Reference
HTTP and HTTPS Traffic
# HTTP traffic monitoring
sudo tcpdump -i any -A 'tcp port 80'

# HTTPS handshake verification
sudo tcpdump -i any 'tcp port 443 and (tcp[tcpflags] & tcp-syn != 0)'
DNS Debugging
# DNS query debugging with verbose output
sudo tcpdump -i any -vvv port 53
Inter-Host Communication
# All traffic between specific IPs
sudo tcpdump host 192.168.1.100 and host 192.168.1.200
Broadcast and Multicast
# Broadcast/multicast packets
sudo tcpdump ether broadcast or ether multicast
Layer 2 and Layer 3 Protocols
# ARP packets
sudo tcpdump arp

# IPv6 traffic
sudo tcpdump ip6

# ICMP (ping) packets
sudo tcpdump icmp
Connection Issues
# Abnormal connection termination monitoring
sudo tcpdump 'tcp[tcpflags] & tcp-rst != 0'

# Retransmission detection (indirect)
sudo tcpdump -tttt 'tcp[tcpflags] & tcp-push != 0'
Quick Reference Card
| Task | Command |
|---|---|
| Capture all traffic | sudo tcpdump -i any |
| Filter by host | sudo tcpdump host example.com |
| Filter by port | sudo tcpdump port 443 |
| Save to file | sudo tcpdump -w capture.pcap |
| Read from file | tcpdump -r capture.pcap |
| Verbose timestamps | sudo tcpdump -tttt |
| Show packet contents | sudo tcpdump -X |
| Limit packet count | sudo tcpdump -c 100 |
Conclusion
tcpdump is a powerful tool that enables network problem diagnosis through data rather than speculation. The SSH connection delay issue discussed in this guide would have remained a vague “the network is slow” complaint without tcpdump. By using packet analysis, I confirmed precisely that a 30-second delay was occurring during the SSH key exchange phase and could address the root cause.
Key Takeaways
- Filtering is Essential: Use precise filters to capture only relevant traffic
- Leverage Timestamps: Measure delay intervals accurately with timestamp options
- Analyze Flags: SYN, ACK, RST flags reveal connection state and issues
- Save for Later: PCAP files enable detailed post-capture analysis
When network problems occur, start with tcpdump! The visibility it provides transforms troubleshooting from guesswork into systematic diagnosis.

Comments