11 min to read
ELK to EFK Migration: Why and How We Replaced Logstash with Fluentd
A practical guide to migrating from ELK Stack to EFK Stack on Kubernetes with Fluent Bit, Fluentd, and real-world log processing pipelines
Overview
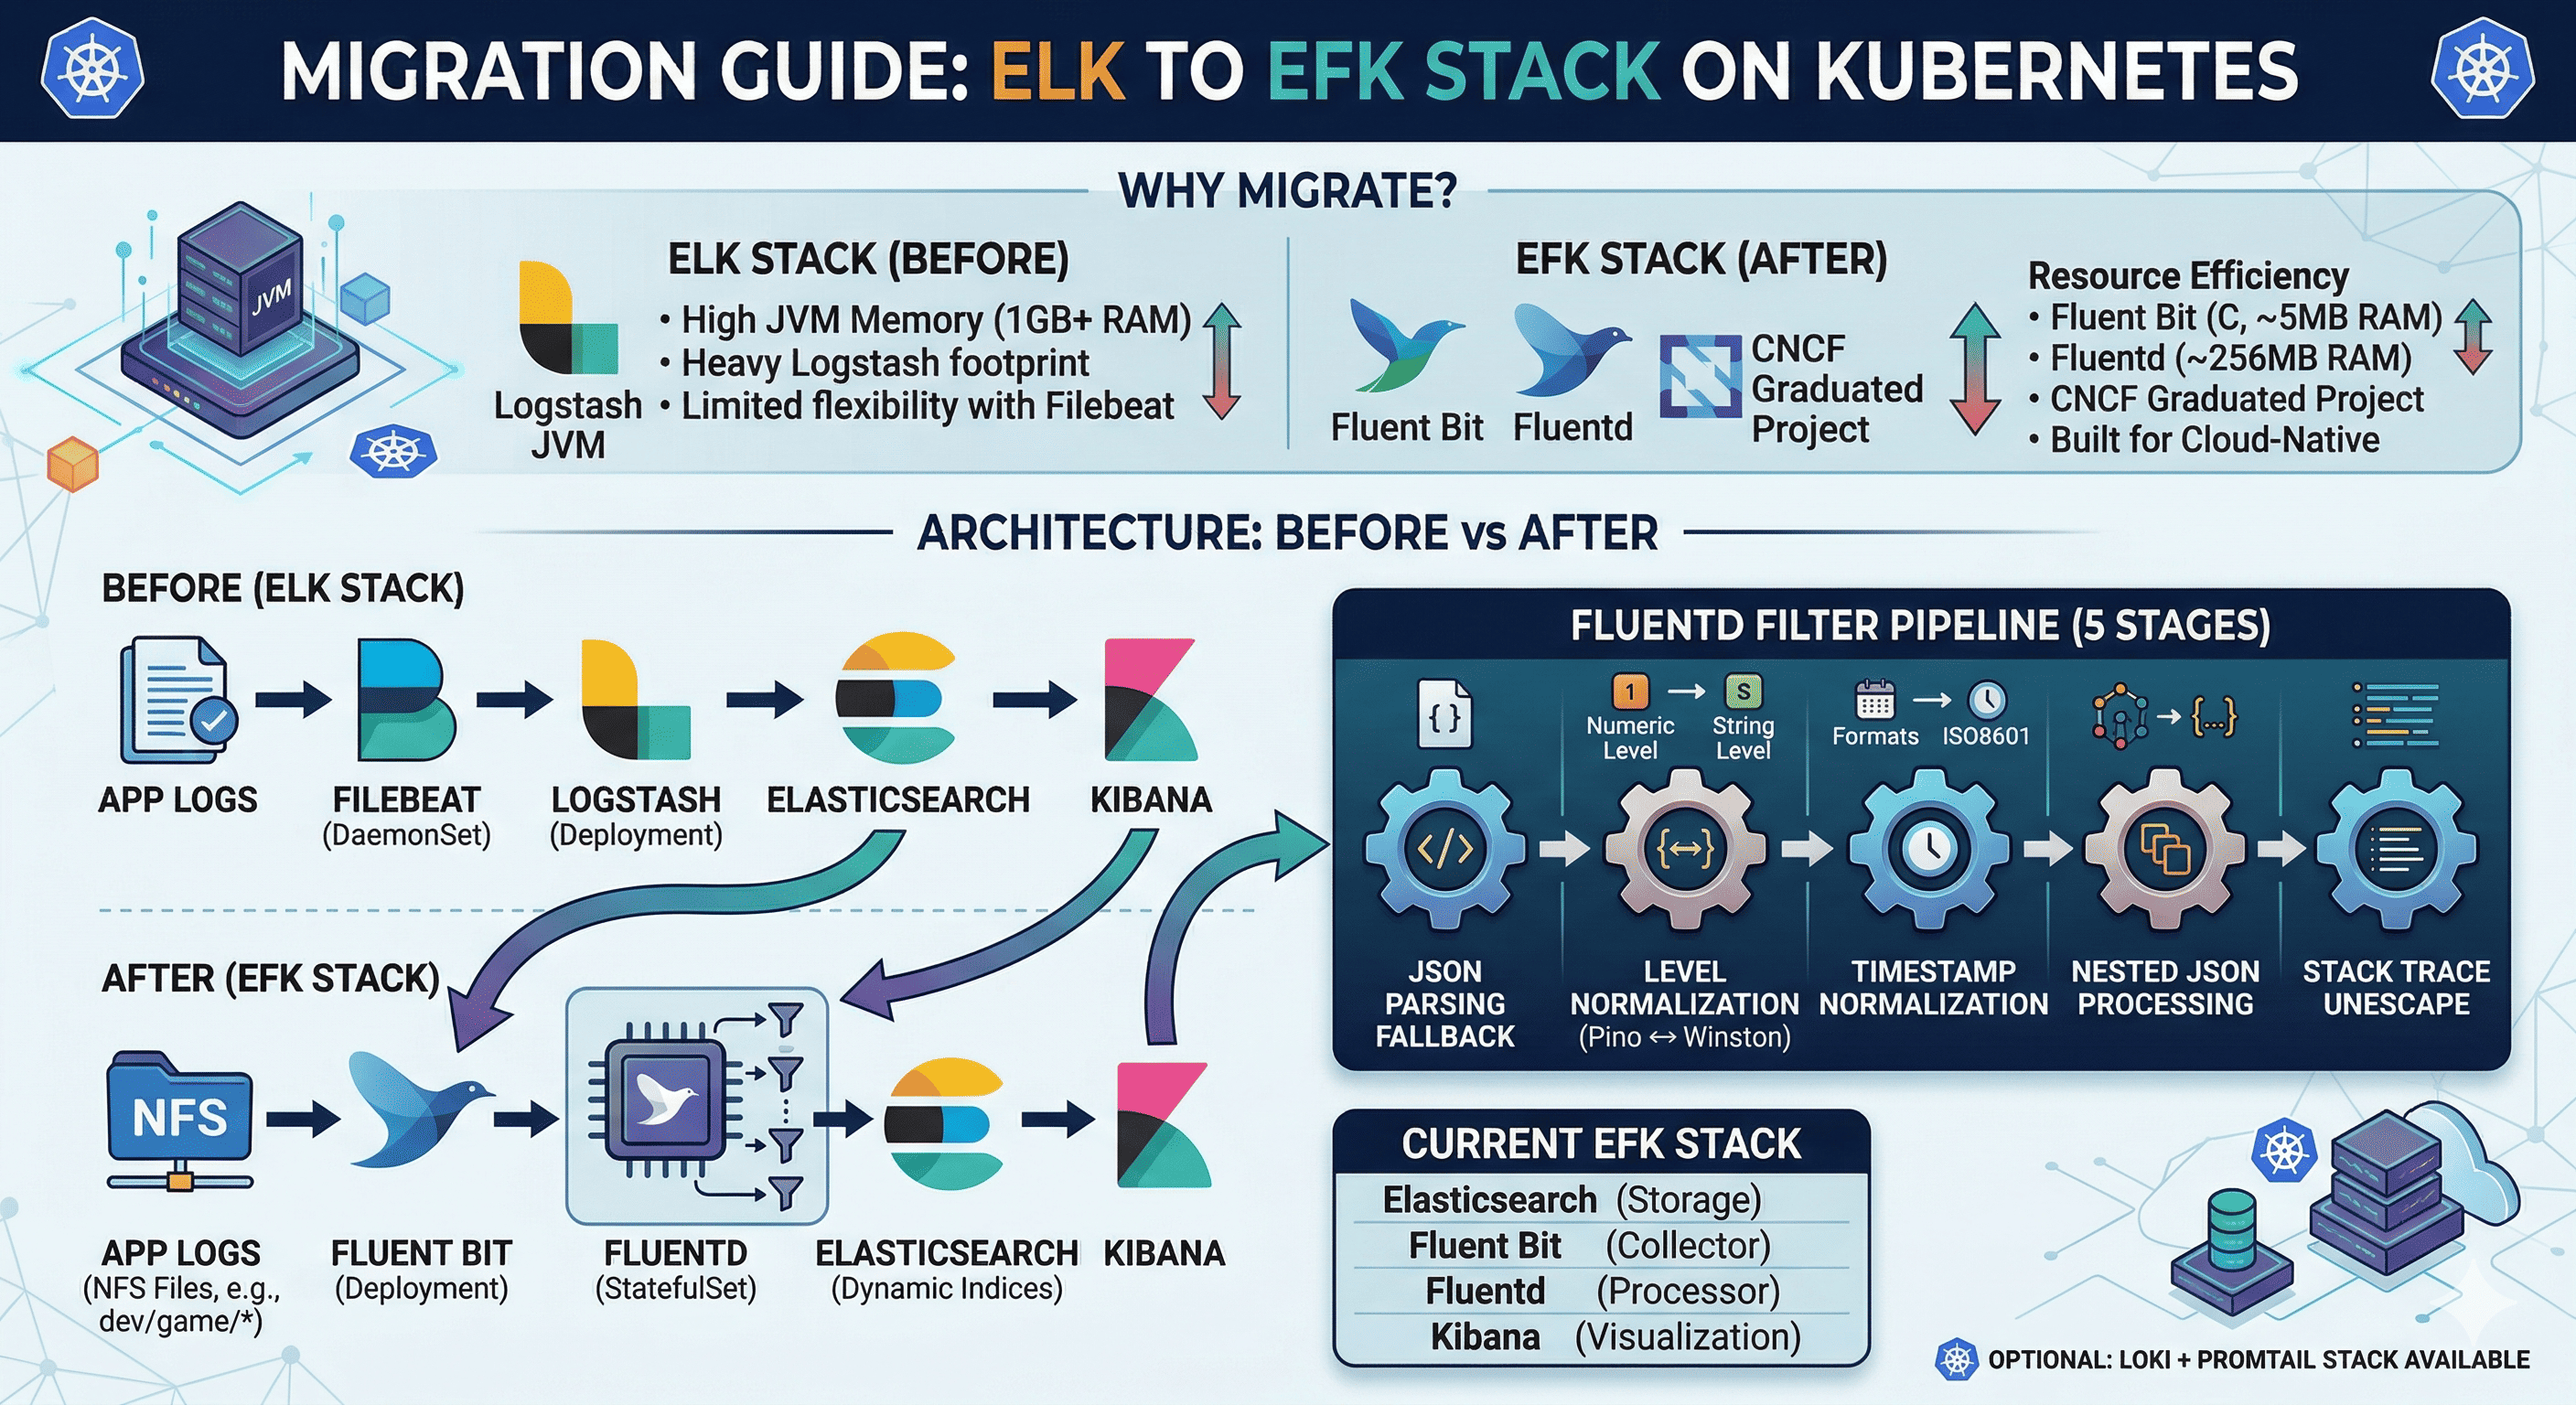
The ELK Stack (Elasticsearch + Logstash + Kibana) has been the industry standard for log management. However, in Kubernetes environments, Logstash’s heavy JVM footprint and Filebeat’s limited flexibility led us to migrate to the EFK Stack — replacing Logstash with Fluentd for log processing and Filebeat with Fluent Bit for log collection.
This post documents our migration journey, including the architectural decisions, the Fluentd filter pipeline design, and lessons learned.
Why Migrate from ELK to EFK?
| Aspect | ELK (Before) | EFK (After) |
|---|---|---|
| Log Collector | Filebeat (Go, ~30MB) | Fluent Bit (C, ~5MB) |
| Log Processor | Logstash (JVM, ~1GB RAM) | Fluentd (Ruby, ~256MB RAM) |
| Storage | Elasticsearch | Elasticsearch (unchanged) |
| Visualization | Kibana | Kibana (unchanged) |
| Memory Usage | High (JVM overhead) | Low (native + lightweight Ruby) |
| Plugin Ecosystem | Logstash plugins (Ruby) | Fluentd plugins (700+) + Fluent Bit (CNCF) |
| K8s Native | Not designed for K8s | CNCF graduated project, built for cloud-native |
Key reasons for our migration:
- Resource efficiency: Logstash required 1GB+ RAM per instance. Fluentd runs with ~256MB.
- Fluent Bit is CNCF: Cloud-native, lightweight, purpose-built for Kubernetes log collection.
- Two-tier architecture: Fluent Bit (lightweight collector) → Fluentd (heavy processing) is more scalable than Filebeat → Logstash.
- Better plugin ecosystem: Fluentd’s 700+ plugins cover more use cases than Logstash.
Architecture: Before vs After
Before (ELK)
App Logs → Filebeat (DaemonSet) → Logstash (Deployment) → Elasticsearch → Kibana
After (EFK)
NFS Log Files
├── dev/game/*
├── dev/battle/*
├── staging/game/*
└── qa/game/*
      │
      ▼
Fluent Bit (Deployment)
  - Tail input (NFS logs)
  - JSON parsing
  - Metadata injection (env, app, component)
  - Forward output → port 24224
      │
      ▼
Fluentd (StatefulSet)
  - Forward input (port 24224)
  - 5-stage filter pipeline
  - Elasticsearch output (dynamic index)
      │
      ▼
Elasticsearch (StatefulSet)
  - Indices: dev-myapp-game, dev-myapp-battle, etc.
  - HTTPS with certificate auth
      │
      ▼
Kibana (Deployment)
  - Dashboard: kibana.example.com
Component Details
Fluent Bit — Lightweight Log Collector
Fluent Bit runs as a Deployment (not DaemonSet) because logs are stored on NFS, not on local nodes.
| Setting | Value |
|---|---|
| Image | cr.fluentbit.io/fluent/fluent-bit:3.1.4 |
| Kind | Deployment (1 replica) |
| Input | Tail (NFS-mounted log files) |
| Output | Forward → Fluentd:24224 |
| Resources | 100m~1000m CPU, 100Mi~2Gi RAM |
Input Configuration:
[INPUT]
    Name              tail
    Tag               myapp.dev.game
    Path              /fluent-bit/logs/myapp/dev/game/*
    Parser            myapp_json
    Refresh_Interval  5
    Rotate_Wait       30
    Skip_Long_Lines   On
    DB                /fluent-bit/db/dev-game.db
Metadata Injection (Filter):
[FILTER]
    Name   modify
    Match  myapp.dev.game
    Set    environment dev
    Set    app myapp
    Set    component game
    Set    label game
Fluent Bit adds metadata (environment, app, component) to each log entry before forwarding to Fluentd. This enables dynamic index routing in Elasticsearch.
Fluentd — Log Processor
Fluentd is the heavy lifter — it receives logs from Fluent Bit and runs them through a 5-stage filter pipeline before sending to Elasticsearch.
| Setting | Value |
|---|---|
| Image | fluent/fluentd-kubernetes-daemonset:v1.16 |
| Kind | StatefulSet (1 replica) |
| Input | Forward (port 24224) |
| Output | Elasticsearch (HTTPS, dynamic index) |
| Buffer | File-based, 16MB chunks, 10s flush, 4 threads |
| Resources | 200m~1000m CPU, 256Mi~1Gi RAM |
Fluentd Filter Pipeline (5 Stages)
This is the most critical part of the migration — replacing Logstash’s data processing with Fluentd filters.
Stage 1: JSON Parsing Fallback
If Fluent Bit’s parser failed to parse JSON, Fluentd attempts a second parse.
<filter myapp.**>
  @type parser
  key_name log
  reserve_data true
  remove_key_name_field true
  <parse>
    @type json
    time_key @timestamp
    time_format %Y-%m-%dT%H:%M:%S.%L%z
  </parse>
</filter>
Stage 2: Pino ↔ Winston Log Level Normalization
Our applications use both Pino (numeric levels) and Winston (string levels). Fluentd normalizes them.
Stage 3: Timestamp Normalization
Unifies different timestamp formats to a single @timestamp field in Asia/Seoul timezone.
# Pino: Unix milliseconds → ISO8601
if record["time"].is_a?(Numeric)
  record["@timestamp"] = Time.at(record["time"] / 1000.0).localtime("+09:00").strftime(...)
end

# Winston: ISO8601 string → normalized
if record["timestamp"].is_a?(String)
  record["@timestamp"] = Time.parse(record["timestamp"]).localtime("+09:00").strftime(...)
end

# Cleanup: remove source fields
record.delete("time"); record.delete("msg"); record.delete("filepath"); record.delete("req")
Stage 4: Nested JSON Processing
Converts nested objects (requestBody, responseBody) to JSON strings to prevent Elasticsearch mapping explosion.
["requestBody", "responseBody", "requestHeader"].each do |field|
  if record[field].is_a?(Hash) || record[field].is_a?(Array)
    record[field] = record[field].to_json
  end
end
Stage 5: Stack Trace Unescape
Processes escaped newlines in error stack traces for proper display in Kibana.
Elasticsearch Output (Dynamic Index)
Fluentd routes logs to different Elasticsearch indices based on the log_source field set by Fluent Bit’s metadata.
<match myapp.**>
  @type elasticsearch
  host elasticsearch-master
  port 9200
  scheme https
  ssl_verify false
  logstash_format false
  index_name ${log_source}
  <!-- Results in indices like: dev-myapp-game, stg-myapp-game, qa-myapp-game -->

  <buffer tag>
    @type file
    path /var/log/fluent/elasticsearch-buffers
    flush_interval 10s
    flush_thread_count 4
    chunk_limit_size 16MB
    retry_type exponential_backoff
    retry_max_times 10
  </buffer>
</match>
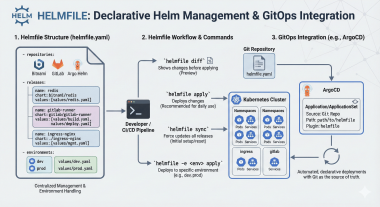
Installation Guide
Fluent Bit Installation (Helm)
Fluent Bit is deployed as a local Helm chart since the configuration includes custom templates for NFS PV/PVC mounts.
# helmfile.yaml
repositories:
  - name: fluent
    url: https://fluent.github.io/helm-charts

releases:
  - name: fluent-bit
    namespace: monitoring
    chart: .              # Local chart (custom templates)
    version: 0.56.0
    values:
      - values/mgmt.yaml
# Deploy
cd observability/logging/fluent-bit
helmfile -f helmfile.yaml diff
helmfile -f helmfile.yaml apply

# Verify
kubectl get pods -n monitoring -l app.kubernetes.io/name=fluent-bit
kubectl logs -n monitoring -l app.kubernetes.io/name=fluent-bit
Key values (mgmt.yaml):
kind: Deployment
replicaCount: 1

image:
  repository: cr.fluentbit.io/fluent/fluent-bit
  tag: "3.1.4"

env:
  - name: FLUENT_ELASTICSEARCH_HOST
    value: "elasticsearch-master"
  - name: FLUENT_ELASTICSEARCH_PORT
    value: "9200"

resources:
  requests:
    cpu: 100m
    memory: 100Mi
  limits:
    cpu: 1000m
    memory: 2Gi

# Prometheus ServiceMonitor
serviceMonitor:
  enabled: true
  namespace: monitoring
  interval: 30s
  additionalLabels:
    release: kube-prometheus-stack
Fluentd Installation (Helm)
Fluentd uses an external Helm chart from the Fluent community.
# helmfile.yaml
repositories:
  - name: fluent
    url: https://fluent.github.io/helm-charts

releases:
  - name: fluentd
    namespace: monitoring
    chart: fluent/fluentd
    version: 0.5.3
    values:
      - values/mgmt.yaml
# Deploy
cd observability/logging/fluentd
helmfile -f helmfile.yaml diff
helmfile -f helmfile.yaml apply

# Verify
kubectl get pods -n monitoring -l app.kubernetes.io/name=fluentd
kubectl logs -n monitoring -l app.kubernetes.io/name=fluentd
Key values (mgmt.yaml):
kind: StatefulSet
variant: elasticsearch7
replicaCount: 1

image:
  repository: fluent/fluentd-kubernetes-daemonset
  tag: "v1.16-debian-elasticsearch7-1"

# Forwarder service (receives from Fluent Bit)
service:
  type: ClusterIP
  ports:
    - name: forwarder
      containerPort: 24224

# Elasticsearch connection
env:
  - name: FLUENT_ELASTICSEARCH_HOST
    value: "elasticsearch-master"
  - name: FLUENT_ELASTICSEARCH_PORT
    value: "9200"
  - name: FLUENT_ELASTICSEARCH_SCHEME
    value: "https"
  - name: FLUENT_ELASTICSEARCH_SSL_VERIFY
    value: "false"

# Persistent buffer storage
persistence:
  enabled: true
  storageClass: nfs-client-server
  size: 10Gi
  accessMode: ReadWriteOnce

resources:
  requests:
    cpu: 200m
    memory: 256Mi
  limits:
    cpu: 1000m
    memory: 1Gi

# Elasticsearch certificates
volumes:
  - name: elasticsearch-certs
    secret:
      secretName: elasticsearch-master-certs
volumeMounts:
  - name: elasticsearch-certs
    mountPath: /certs
    readOnly: true

# Prometheus ServiceMonitor
serviceMonitor:
  enabled: true
  namespace: monitoring
  interval: 30s
  additionalLabels:
    release: kube-prometheus-stack
Deployment Order
1. Elasticsearch (must be running first)
2. Fluentd (connects to Elasticsearch, listens on port 24224)
3. Fluent Bit (forwards logs to Fluentd:24224)
4. Kibana (connects to Elasticsearch for visualization)
Verification
# Check all EFK components are running
kubectl get pods -n monitoring | grep -E "elastic|fluent|kibana"

# Verify Fluent Bit → Fluentd connection
kubectl logs -n monitoring -l app.kubernetes.io/name=fluent-bit | grep -i "forward"

# Verify Fluentd → Elasticsearch connection
kubectl logs -n monitoring -l app.kubernetes.io/name=fluentd | grep -i "elasticsearch"

# Check Elasticsearch indices are being created
curl -sk -u elastic:<your-password> https://elasticsearch.example.com:9200/_cat/indices?v
Current Stack Summary
| Component | Version | Type | Role |
|---|---|---|---|
| Elasticsearch | 8.5.1 | StatefulSet (1 replica) | Log storage & search |
| Fluent Bit | 3.1.4 | Deployment (1 replica) | Lightweight log collection from NFS |
| Fluentd | v1.16 | StatefulSet (1 replica) | Log processing & Elasticsearch output |
| Kibana | 8.5.1 | Deployment (1 replica) | Log visualization dashboard |
Optional: Loki + Promtail Stack
As an alternative to EFK, Loki + Promtail is available as an optional stack for Grafana-native log aggregation.
Container Logs → Promtail (DaemonSet) → Loki (SingleBinary) → Grafana
This is useful for teams already using Grafana who prefer label-based log querying over full-text search. Both stacks can coexist.
Migration Lessons Learned
- Two-tier is better: Separating collection (Fluent Bit) from processing (Fluentd) improves scalability and fault isolation.
- Log format normalization matters: Applications using different logging libraries (Pino vs Winston) need careful field mapping in the processing layer.
- Nested JSON causes mapping explosion: Always flatten or stringify nested objects before sending to Elasticsearch. Otherwise,
total_fields.limiterrors will occur. - Keep deprecated configs: Moving old components to
_deprecated/instead of deleting them provides a reference for rollback if needed. - Buffer configuration is critical: File-based buffers in Fluentd prevent log loss during Elasticsearch downtime. Tune
flush_intervalandchunk_limit_sizebased on log volume.

Comments