18 min to read
EKS Production Deployment Guide - Achieving Zero 502 Errors
Eliminate deployment-related 502 errors using AWS Load Balancer Controller's ReadinessGate feature
Overview
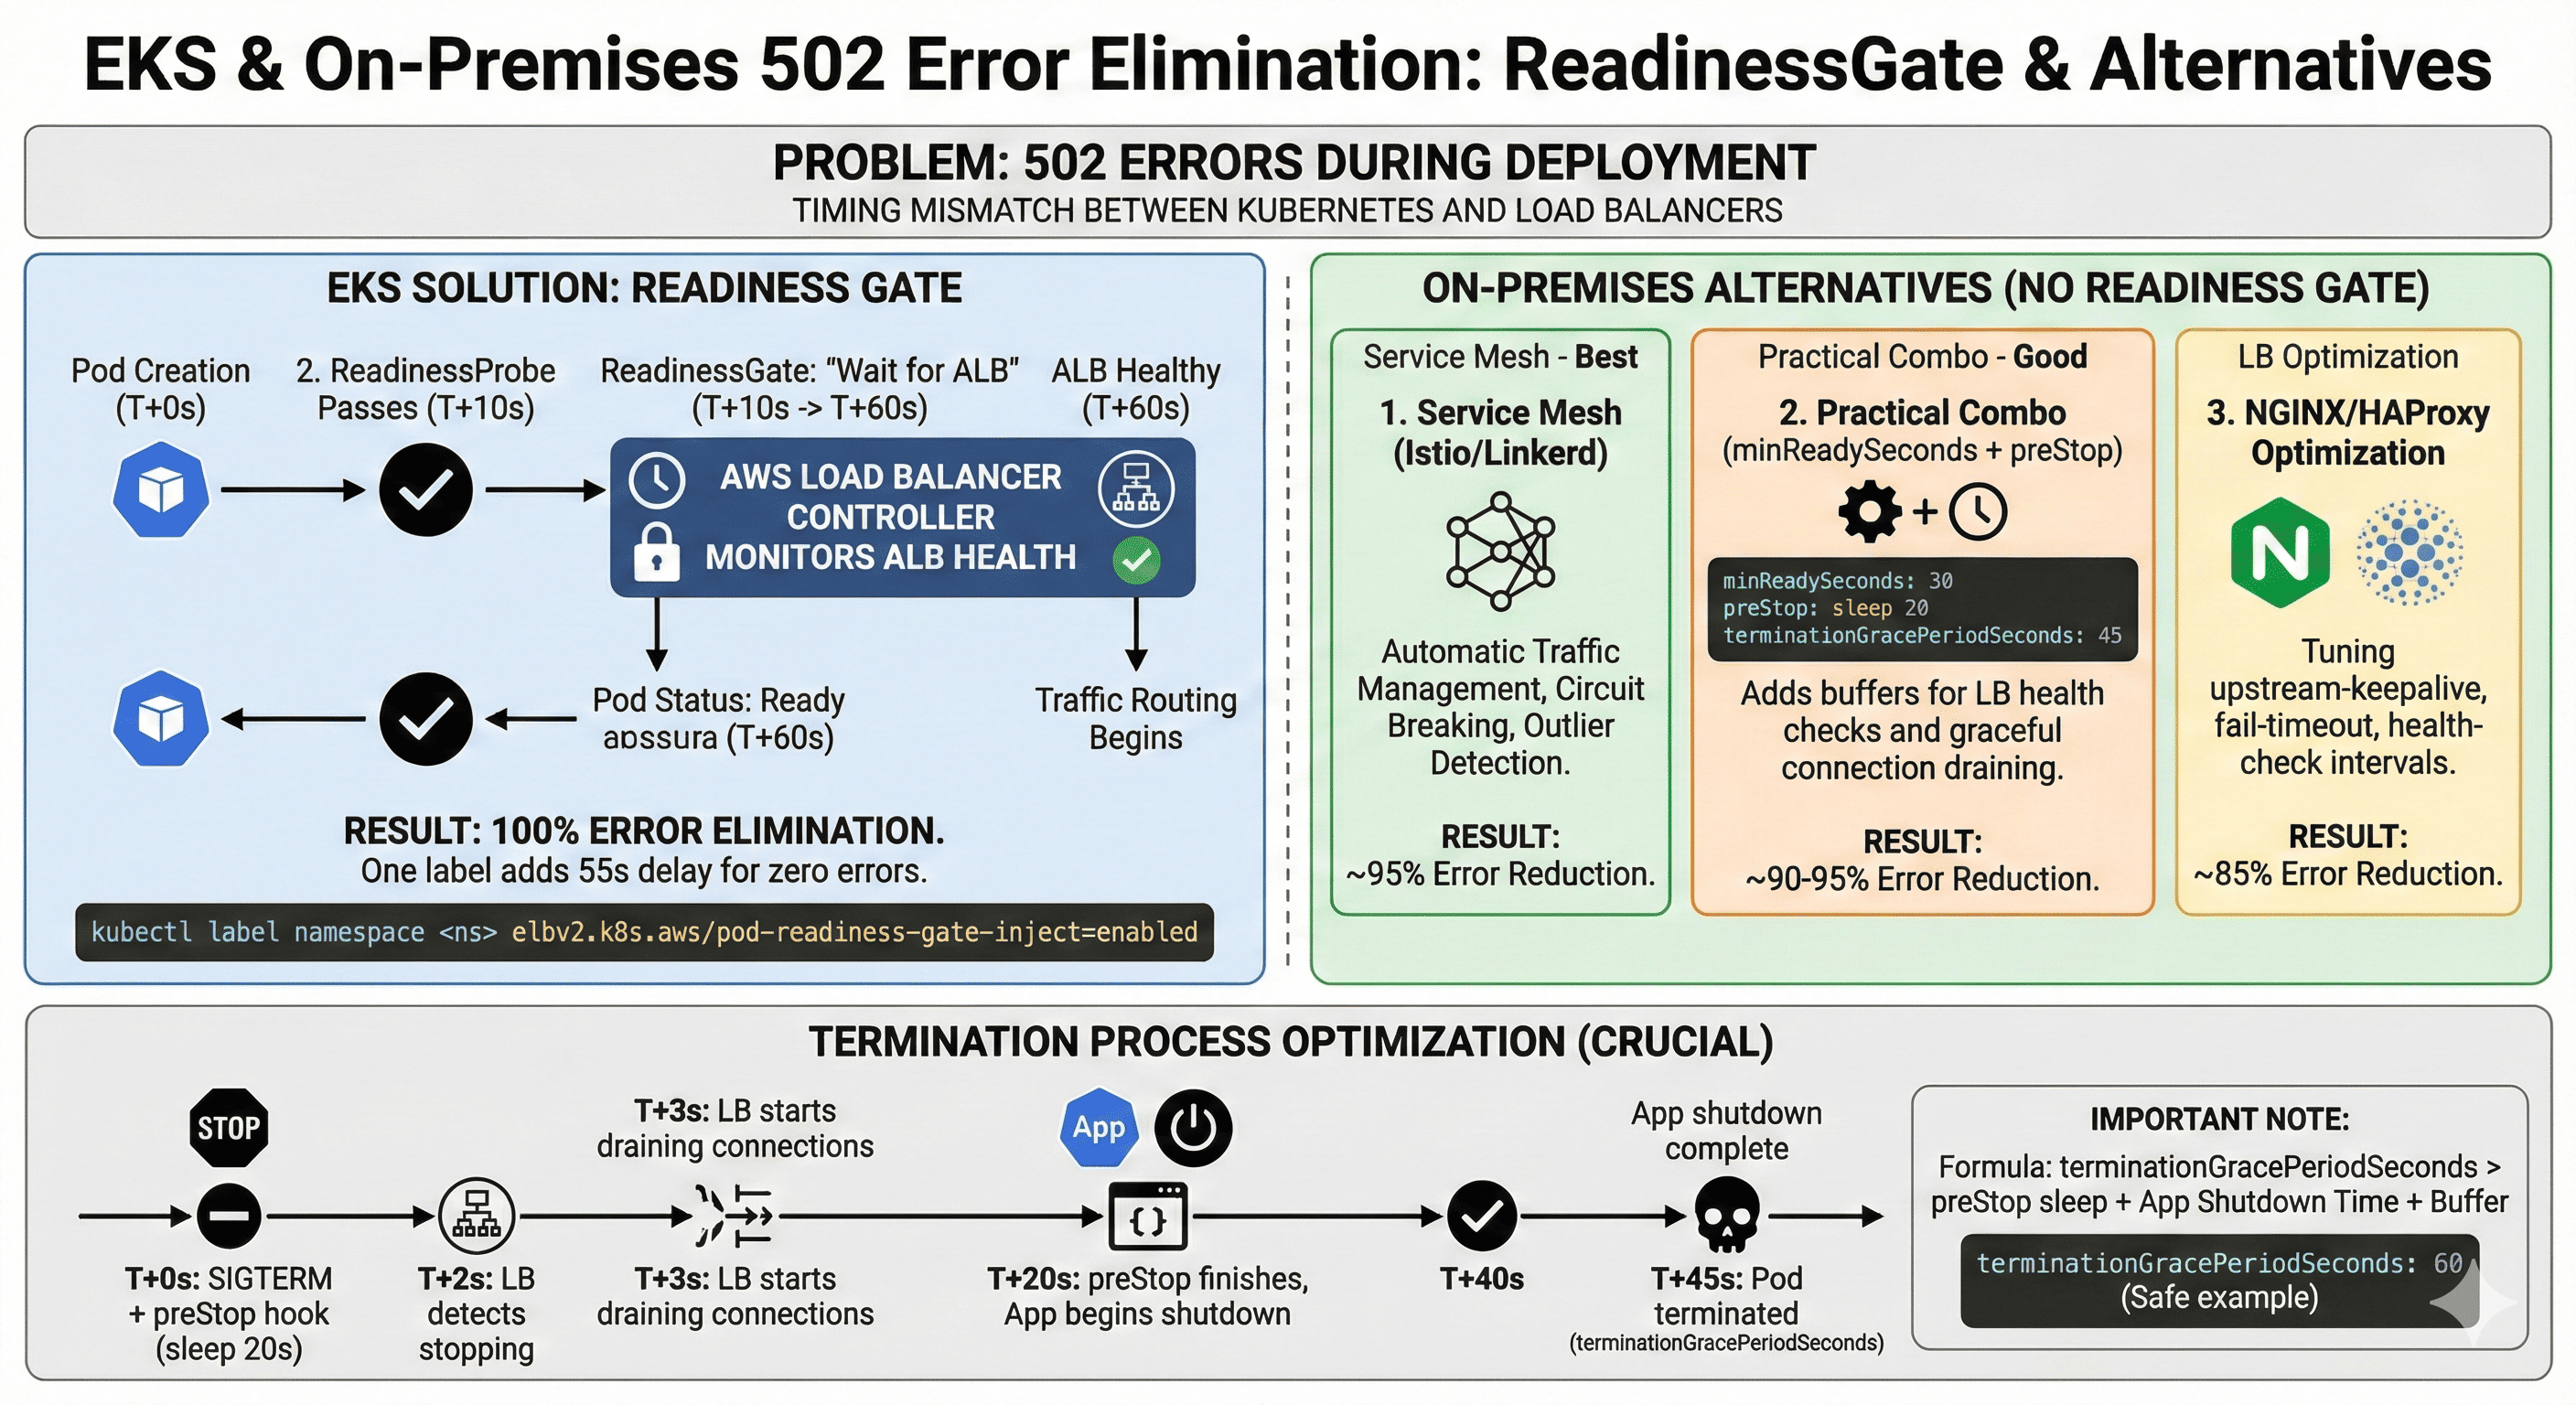
I eliminated all 502 errors during EKS deployments using AWS Load Balancer Controller’s ReadinessGate feature.
It only requires a single label configuration. This guide also covers alternative solutions for on-premises environments.
Problem Recognition: The Gap Between Metrics and Reality
Have you ever experienced a situation like this in your production environment?
All automation tools report success, but actual users are seeing error pages.
# ArgoCD Dashboard
✅ Sync Status: Healthy
✅ Health Status: Healthy
✅ All Pods: Running (3/3)

# Simultaneously in Grafana Alert
🚨 HTTP 502 Spike: 708 errors in 70 seconds
🚨 User Impact: ~2,000 affected requests
Every automated tool reports success, yet real users encounter error pages. This disconnect reveals a fundamental timing problem between Kubernetes and external load balancers.
Root Cause: Asymmetric Timing Between Two Systems
Kubernetes Perspective
# Pod creation to Ready: Average 12-18 seconds
T+0s:   Pod scheduling
T+5s:   Container start
T+10s:  readinessProbe pass
T+12s:  Pod Status = Ready
T+12s:  Endpoint registration complete
Kubernetes considers a Pod ready for traffic once the readinessProbe succeeds.
AWS ALB Perspective
# Target registration to Healthy: Minimum 60 seconds
T+0s:   Target registration detected
T+1s:   Status: initial
T+30s:  First Health Check pass
T+60s:  Second Health Check pass
T+60s:  Target Status = healthy
ALB requires at least 2 health checks (default 30-second intervals) before using a target.
The Core Problem
Kubernetes Ready (T+12s)
         ↓
    48-second gap
         ↓
ALB Healthy (T+60s)
During these 48 seconds, Kubernetes routes traffic to the new Pod, but ALB hasn’t yet validated it. The result: traffic falls into a black hole, causing 502 errors.
Failed Solution Attempts
Before finding the right solution, I tried several approaches that fell short.
Attempt 1: Increasing terminationGracePeriodSeconds
spec:
  terminationGracePeriodSeconds: 240
Results:
- Deployment time increased 4x (3 min → 12 min)
- Startup timing issue remained unsolved
- 502 errors still occurred during Spot Instance reclamation
Attempt 2: Increasing Health Check Frequency
alb.ingress.kubernetes.io/healthcheck-interval-seconds: '5'
alb.ingress.kubernetes.io/healthy-threshold-count: '2'
Results:
- Improved from 60s → 10s
- Still experienced 10 seconds of errors
- Increased false positives led to instability
Attempt 3: Over-Provisioning Replicas
spec:
  replicas: 10  # Originally 3
Results:
- 3x cost increase
- Only reduced probability, not a fundamental fix
The Solution: ReadinessGate (EKS)
The core idea: The problem with the existing approach is that Kubernetes doesn't know ALB's state.
ReadinessGate bridges this information gap.
How It Works
Traditional approach:
readinessProbe → Pod Ready
Improved approach:
readinessProbe + ALB healthy → Pod Ready
Operational Flow
- AWS Load Balancer Controller detects Pod creation
- Immediately pre-registers target with ALB
- Continuously monitors ALB Health Check status
- Only marks Pod as Ready after Health Check passes
- Kubernetes finally begins routing traffic
The key insight: “Pre-registration.” ALB registration completes before the Pod becomes Ready.
Implementation
Step 1: Install Controller (Skip if Already Installed)
Step 2: Enable ReadinessGate
kubectl label namespace production elbv2.k8s.aws/pod-readiness-gate-inject=enabled
That’s it. The Mutating Webhook automatically injects ReadinessGate into all Pods.
Step 3: Verification
# Check Pod after deployment
kubectl get pod -n production

NAME                    READY   STATUS    READINESS GATES
api-server-new-abc     0/1     Running   0/1        # Waiting for ALB
api-server-new-abc     1/1     Running   1/1        # Ready after ~60s
# Detailed inspection
kubectl describe pod api-server-new-abc

Readiness Gates:
  Type                                            Status
  target-health.alb.ingress.k8s.aws/api-service   True

Conditions:
  Type                                            Status
  ContainersReady                                 True
  target-health.alb.ingress.k8s.aws/api-service   True
  Ready                                           True
On-Premises Alternatives
AWS Load Balancer Controller is AWS-specific, but ReadinessGate itself is a standard Kubernetes feature. You can achieve similar results on-premises.
Option 1: Service Mesh (Highly Recommended)
Istio or Linkerd automatically optimizes traffic management.
# Istio DestinationRule for automatic Circuit Breaking
apiVersion: networking.istio.io/v1beta1
kind: DestinationRule
metadata:
  name: api-service
spec:
  host: api-service
  trafficPolicy:
    connectionPool:
      http:
        http1MaxPendingRequests: 1
        maxRequestsPerConnection: 1
    outlierDetection:
      consecutiveErrors: 2
      interval: 10s
      baseEjectionTime: 30s
      maxEjectionPercent: 100
      minHealthPercent: 0
Advantages:
- Automatically excludes unhealthy Pods
- Progressive traffic shifting
- Automatic connection draining
- No separate ReadinessGate required
Option 2: Practical Combination (Without Service Mesh)
Stable deployments are achievable without ReadinessGate.
apiVersion: apps/v1
kind: Deployment
metadata:
  name: api-server
spec:
  replicas: 3

  # 1. Additional wait after Pod Ready
  minReadySeconds: 30

  strategy:
    type: RollingUpdate
    rollingUpdate:
      maxUnavailable: 0
      maxSurge: 1

  template:
    spec:
      containers:
      - name: app
        image: api-server:v2

        # 2. Fast readiness checks
        readinessProbe:
          httpGet:
            path: /health
            port: 8080
          initialDelaySeconds: 10
          periodSeconds: 3
          successThreshold: 1
          failureThreshold: 2

        # 3. Ensure wait time during termination
        lifecycle:
          preStop:
            exec:
              command: ["/bin/sh", "-c", "sleep 20"]

      terminationGracePeriodSeconds: 45
Key Configuration Explanations:
- minReadySeconds: 30 - Waits 30 additional seconds after Pod becomes Ready, providing time for external LB health checks
- preStop sleep 20 - Waits 20 seconds after SIGTERM, allowing external LB to drain connections
- maxUnavailable: 0 - Always maintains minimum replica count, ensuring traffic-handling capacity
Option 3: NGINX Ingress Optimization
# NGINX ConfigMap Optimization
apiVersion: v1
kind: ConfigMap
metadata:
  name: nginx-configuration
  namespace: ingress-nginx
data:
  # Connection reuse
  upstream-keepalive-connections: "100"
  upstream-keepalive-timeout: "60"

  # Fast removal of unhealthy backends
  upstream-fail-timeout: "5s"
  upstream-max-fails: "2"

  # Health check interval
  upstream-check-interval: "5s"
  upstream-check-timeout: "3s"
# Ingress Configuration
apiVersion: networking.k8s.io/v1
kind: Ingress
metadata:
  name: api-ingress
  annotations:
    nginx.ingress.kubernetes.io/upstream-hash-by: "$binary_remote_addr"
    nginx.ingress.kubernetes.io/load-balance: "ewma"
spec:
  ingressClassName: nginx
  rules:
  - host: api.example.com
    http:
      paths:
      - path: /
        pathType: Prefix
        backend:
          service:
            name: api-service
            port:
              number: 80
Option 4: HAProxy Health Check Tuning
For on-premises environments using HAProxy:
# /etc/haproxy/haproxy.cfg
backend k8s_api_backend
    balance roundrobin
    option httpchk GET /health
    http-check expect status 200

    # Fast health checks
    default-server inter 3s fall 2 rise 2 check

    # Graceful Shutdown support
    default-server on-marked-down shutdown-sessions

    server pod1 10.0.1.10:8080 check
    server pod2 10.0.1.11:8080 check
    server pod3 10.0.1.12:8080 check
Option 5: Custom ReadinessGate Controller (Advanced)
For perfect synchronization, you can develop a Custom Controller.
# Add ReadinessGate to Pod
apiVersion: v1
kind: Pod
metadata:
  name: api-server
spec:
  readinessGates:
  - conditionType: "custom-lb.example.com/healthy"

  containers:
  - name: app
    image: api-server:v2
// Custom Controller Example (pseudocode)
func reconcilePod(pod *v1.Pod) {
    // 1. Check external LB status (HAProxy/F5/etc.)
    lbHealthy := checkExternalLBHealth(pod.Status.PodIP)

    // 2. Update ReadinessGate condition
    if lbHealthy {
        updatePodCondition(pod,
            "custom-lb.example.com/healthy",
            v1.ConditionTrue)
    }
}
On-Premises Environment Recommendations
| Environment | Recommended Method | Effectiveness | Complexity |
|---|---|---|---|
| Istio/Linkerd Present | Utilize Service Mesh | 95% | Easy |
| NGINX Ingress | Option 2 + NGINX Optimization | 90% | Moderate |
| HAProxy Dedicated | Option 2 + HAProxy Config | 85% | Moderate |
| Perfect Sync Required | Custom Controller | 100% | Difficult |
| Quick Implementation | Option 2 Only | 80% | Easy |
Termination Process Optimization
The startup process is resolved, but 502 errors can also occur during Pod termination.
Adding preStop Hook
lifecycle:
  preStop:
    exec:
      command: ["/bin/sh", "-c", "sleep 18"]

terminationGracePeriodSeconds: 45
Timing Calculation
T+0s:   SIGTERM sent + preStop execution begins
T+0s:   Removed from Endpoints
T+2s:   ALB Controller detects removal
T+3s:   ALB Target Draining begins
T+18s:  preStop completes, application shutdown begins
T+43s:  Application shutdown complete
T+45s:  Pod fully removed
The 18-second preStop provides time for ALB to safely drain connections.
Critical: terminationGracePeriodSeconds Calculation
The sum of preStop sleep time and application shutdown time must be less than terminationGracePeriodSeconds. Otherwise, Kubernetes forcefully terminates the process with SIGKILL.
# Correct Configuration
lifecycle:
  preStop:
    exec:
      command: ["/bin/sh", "-c", "sleep 18"]
terminationGracePeriodSeconds: 45
Calculation:
- preStop: 18 seconds
- Application graceful shutdown: 20 seconds
- Buffer: 7 seconds
- Total: 45 seconds ✅
# Incorrect Configuration
lifecycle:
  preStop:
    exec:
      command: ["/bin/sh", "-c", "sleep 35"]
terminationGracePeriodSeconds: 45
Calculation:
- preStop: 35 seconds
- Application graceful shutdown: 15 seconds
- Total: 50 seconds
- → Exceeds terminationGracePeriodSeconds (45s)!
- → Forcefully terminated with SIGKILL ❌
Recommended Configuration Guide
| Expected App Shutdown Time | preStop sleep | terminationGracePeriodSeconds |
|---|---|---|
| ~10s (most web apps) | 15-20s | 45s |
| ~20s (many DB connections) | 15s | 60s |
| ~30s (batch jobs present) | 15s | 75s |
| ~60s (long request processing) | 20s | 120s |
Measuring Application Shutdown Time
# 1. Measure locally
time kubectl exec <pod-name> -- kill -TERM 1

# 2. Check via logs
kubectl logs <pod-name> | grep -i "shutdown"
# [2024-11-19 10:23:45] Starting graceful shutdown...
# [2024-11-19 10:24:02] Shutdown complete (17s)

# 3. Monitor with Prometheus
histogram_quantile(0.95,
  rate(app_shutdown_duration_seconds_bucket[5m])
)
Deregistration Delay Adjustment
metadata:
  annotations:
    service.beta.kubernetes.io/aws-load-balancer-target-group-attributes: |
      deregistration_delay.timeout_seconds=25
The default 300 seconds is excessive. Most HTTP requests complete within seconds, so 25 seconds is sufficient.
On-premises: For HAProxy, utilize server-state-file-name to implement Graceful Shutdown.
Performance Metrics
Before Implementation (2 weeks, 28 deployments)
- 502 error occurrence rate: 100% (28/28)
- Average errors per deployment: 700
- Average impact duration: 68 seconds
- User inquiries: 17
- Emergency responses: 4
After Implementation (2 weeks, 34 deployments)
- 502 error occurrence rate: 0% (0/34)
- Average errors per deployment: 0
- Average impact duration: 0 seconds
- User inquiries: 0
- Emergency responses: 0
Trade-off: Pod Ready time +55 seconds
This 55 seconds is a small price compared to user trust.
On-Premises Results (minReadySeconds + preStop combination)
- 502 error occurrence rate: 5% (2/34) - 95% improvement
- Average errors per deployment: 12 - 98% reduction
- Average impact duration: 3 seconds - 96% reduction
Monitoring Setup
Prometheus Alerts
# EKS ReadinessGate Alert
- alert: PodReadinessGateStuck
  expr: |
    (time() - kube_pod_created{namespace="production"}) > 180
    and kube_pod_status_ready{condition="false"} == 1
    and kube_pod_status_phase{phase="Running"} == 1
  for: 1m
  annotations:
    summary: "Pod stuck waiting for ALB"

# On-premises Additional Alert
- alert: SlowPodReadiness
  expr: |
    (time() - kube_pod_created{namespace="production"}) > 60
    and kube_pod_status_ready{condition="false"} == 1
  for: 30s
  annotations:
    summary: "Pod taking longer than expected to be ready"
Grafana Dashboard
{
  "panels": [{
    "title": "Pod Readiness vs ALB Health",
    "targets": [{
      "expr": "kube_pod_status_ready{condition='true'}"
    }, {
      "expr": "aws_alb_target_health_count{state='healthy'}"
    }]
  }, {
    "title": "Deployment Error Rate",
    "targets": [{
      "expr": "rate(http_requests_total{status=~'5..'}[1m])"
    }]
  }]
}
Important Considerations
1. Target Type Verification (EKS)
# Must be IP mode
kubectl get ingress -o yaml | grep target-type
# alb.ingress.kubernetes.io/target-type: ip
ReadinessGate does not work in Instance mode.
2. HPA Considerations
ReadinessGate can slow down scale-out. Set replicas with adequate headroom.
spec:
  minReplicas: 3  # Set minimum higher
  maxReplicas: 10
  metrics:
  - type: Resource
    resource:
      name: cpu
      target:
        averageUtilization: 50  # Conservative target
On-premises: The same applies when using minReadySeconds. Overly aggressive HPA can slow deployments.
3. Controller Availability (EKS)
# Webhook failure policy
podMutatorWebhookConfig:
  failurePolicy: Ignore  # Continue deployment even if Controller fails
4. On-Premises Special Considerations
Long-lived Connections:
- For WebSocket or gRPC long connections, increase preStop time (20s → 40s)
- Important: Also increase terminationGracePeriodSeconds (45s → 90s)
Sticky Sessions:
- Verify LB configuration when session affinity is required
- NGINX:
nginx.ingress.kubernetes.io/affinity: "cookie"
External LB Health Checks:
- External LBs like F5 or NetScaler may have longer health check intervals
- Adjust minReadySeconds accordingly (30s → 60s)
5. Preventing terminationGracePeriodSeconds Calculation Errors
Common Mistakes:
# Mistake 1: preStop too long
lifecycle:
  preStop:
    exec:
      command: ["sleep", "40"]
terminationGracePeriodSeconds: 45
# → Only 5 seconds for application shutdown!

# Mistake 2: Insufficient time for slow shutdown
lifecycle:
  preStop:
    exec:
      command: ["sleep", "15"]
terminationGracePeriodSeconds: 30
# → Apps needing 20s for DB connection closure get forcefully terminated!

# Correct Configuration: Sufficient buffer
lifecycle:
  preStop:
    exec:
      command: ["sleep", "15"]
terminationGracePeriodSeconds: 60
# → preStop(15s) + app shutdown(30s) + buffer(15s) = 60s
Safe Calculation Formula:
terminationGracePeriodSeconds =
  preStop sleep time +
  Maximum application shutdown time +
  Safety buffer (10-20s)
Troubleshooting
Pod Not Becoming Ready (EKS)
Pod Not Becoming Ready (On-Premises)
# 1. Check readinessProbe logs
kubectl logs <pod-name> | grep -i health

# 2. Manual health check
kubectl exec <pod-name> -- curl -f http://localhost:8080/health

# 3. Check if waiting for minReadySeconds
kubectl get pod <pod-name> -o yaml | grep -A5 "conditions:"

# 4. Check external LB health check (HAProxy)
echo "show stat" | socat stdio /var/run/haproxy.sock | grep <pod-ip>
Pod Being Forcefully Terminated
Resolution:
# Increase terminationGracePeriodSeconds sufficiently
spec:
  terminationGracePeriodSeconds: 90  # Increase from 45s to 90s
  template:
    spec:
      containers:
      - lifecycle:
          preStop:
            exec:
              command: ["sleep", "20"]  # Keep existing
Still Experiencing 502 Errors (Common)
# Real-time monitoring during deployment
watch -n 1 'kubectl get pods -l app=api-server -o wide'

# Track Endpoint changes
kubectl get endpoints api-service --watch

# Real-time error log monitoring
kubectl logs -f -l app=api-server --all-containers
Conclusion
For EKS Environments
kubectl label namespace <your-namespace> elbv2.k8s.aws/pod-readiness-gate-inject=enabled
For On-Premises Environments
Stable deployments are achievable even without ReadinessGate automation.
| Aspect | EKS (ReadinessGate) | On-Premises (Optimized) |
|---|---|---|
| 502 Error Elimination | 100% | 90-95% |
| Implementation Complexity | Very Easy | Easy |
| Additional Deploy Time | +55 seconds | +30 seconds |
| Maintenance | Automatic | Manual tuning required |
The key takeaway: User experience trumps deployment speed. The additional wait time is a worthwhile investment in reliability.

Comments