6 min to read
Deep Dive into OpenStack Ceilometer
Understanding OpenStack's Telemetry and Monitoring Service
Understanding OpenStack Ceilometer
Ceilometer is OpenStack’s telemetry and monitoring service that collects measurements of resource usage and provides data for billing and performance monitoring.
It integrates with various OpenStack services to gather metrics and events for comprehensive cloud resource management.
What is Ceilometer?
The Telemetry Service
Ceilometer is OpenStack’s monitoring and metering service, providing the following capabilities:
- Resource Monitoring: Collects usage data from various OpenStack services
- Event Tracking: Records and analyzes system events
- Alarm Management: Triggers threshold-based alerts
- Billing Integration: Supplies usage data for billing purposes
By collecting and analyzing resource usage data, Ceilometer enables effective cloud resource management and cost control.
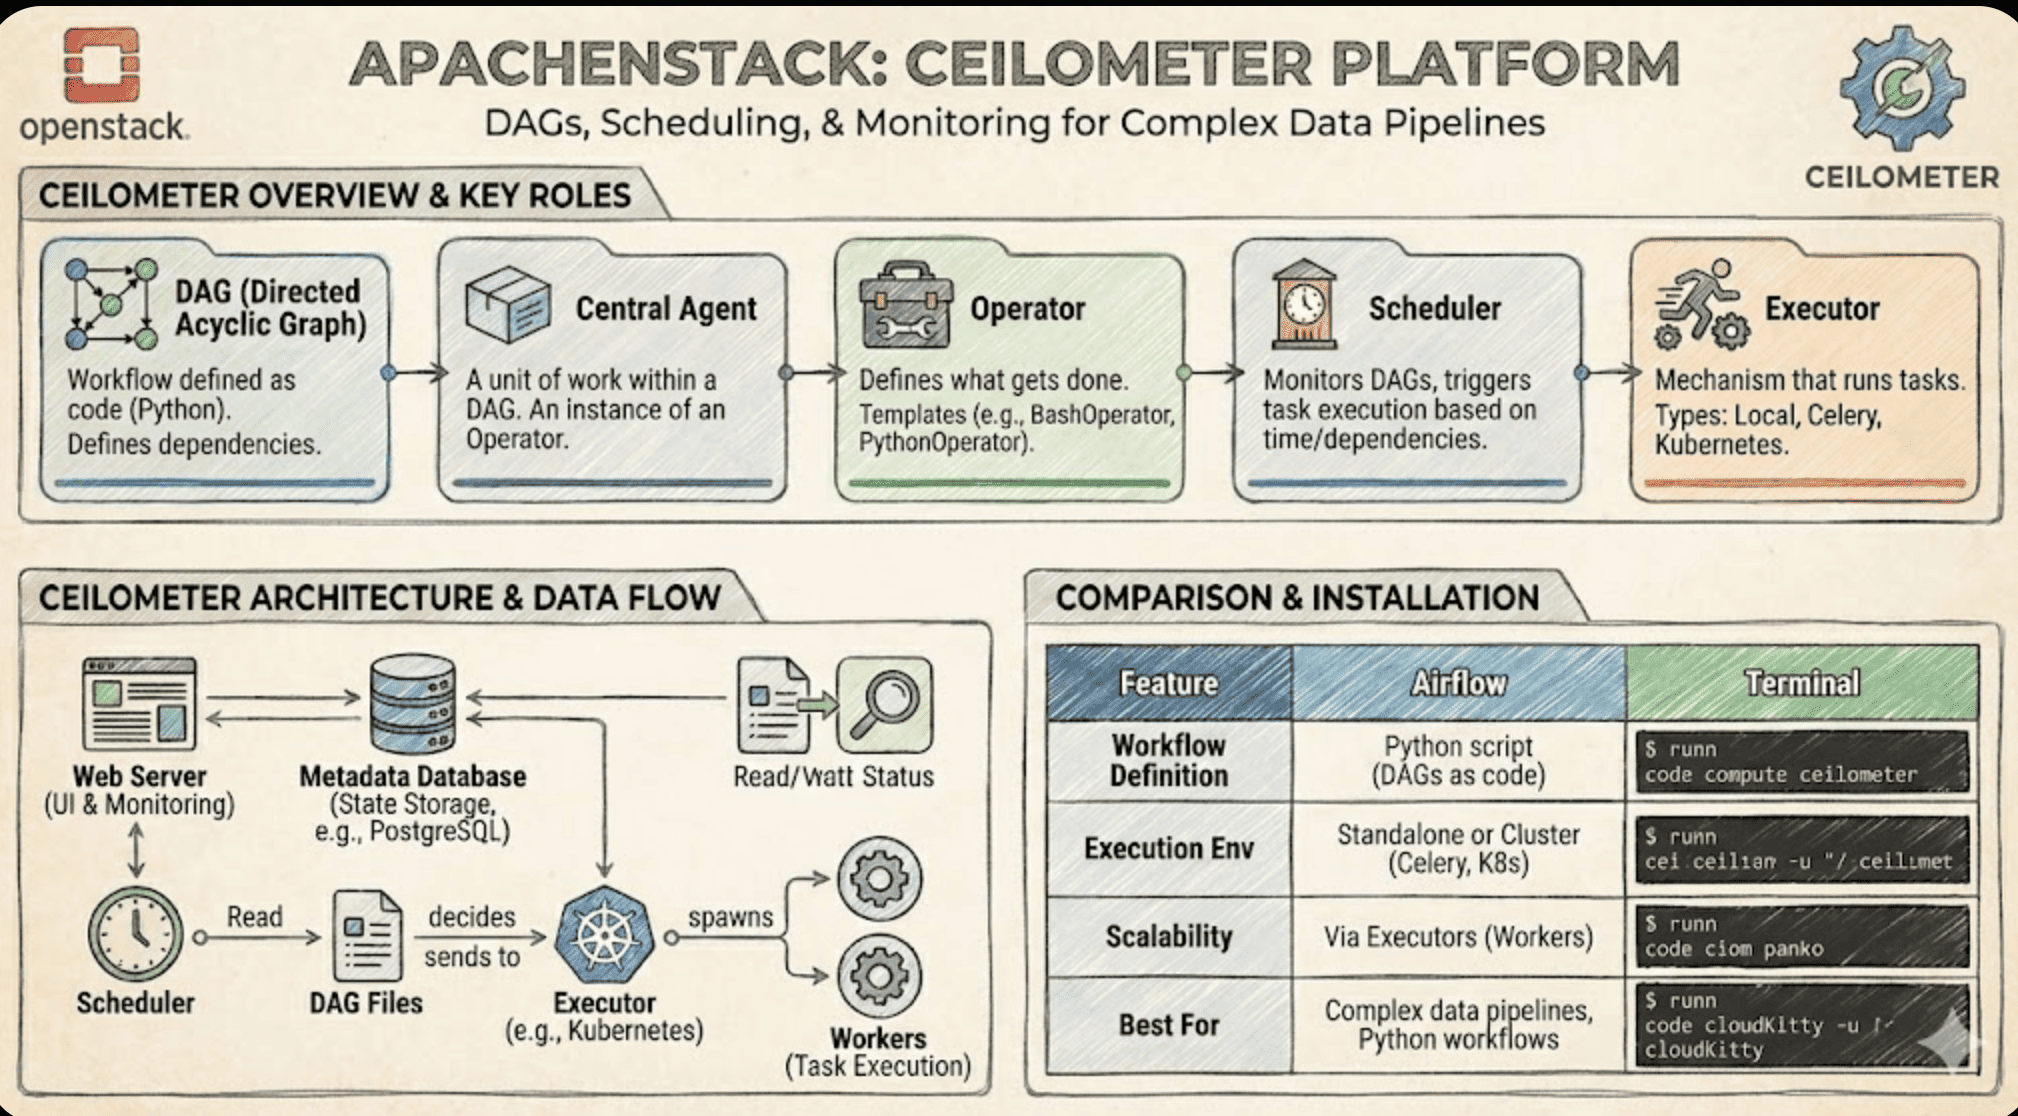
Ceilometer Architecture Overview (Diagram Description)
- Core Features: Resource Monitoring, Event Tracking, Alarm Management
- Service Integration: Nova, Neutron, Cinder, and more
- Data Collection: Metrics, Events, Data Storage
- Monitoring: Performance, Usage Tracking, Alert Generation
Ceilometer Architecture and Components
Ceilometer’s architecture consists of several key components that work together to provide comprehensive monitoring and metering capabilities.
Each component plays a specific role in the data collection and processing pipeline.
Core Components
| Component | Role | Description |
|---|---|---|
| Compute Agent | Instance Metrics |
|
| Central Agent | Service Metrics |
|
| Notification Agent | Event Collection |
|
| Collector | Data Storage |
|
Data Flow
Ceilometer’s data collection flow:
- Metric Generation: OpenStack services generate metrics
- Agent Collection: Agents collect metrics via API calls
- Data Storage: Collector stores data in backend storage
- Alarm Processing: Aodh processes threshold-based alarms
- Billing Integration: Usage data is used for billing
This flow enables monitoring and metering of cloud resources.
Key Features and Capabilities
Ceilometer provides comprehensive monitoring and metering capabilities that enable effective resource management and cost control.
These features make it a powerful tool for cloud operations.
Core Features
| Feature | Description | Benefits |
|---|---|---|
| Resource Monitoring | Track resource usage across services |
|
| Event Tracking | Monitor system events and changes |
|
| Alarm Management | Configure and manage alerts |
|
Service Integration
Ceilometer integrates with the following services:
- Aodh: Alarm service for threshold monitoring
- Gnocchi: Time-series database for metrics
- Panko: Event storage service
- CloudKitty: Rating and billing service
These integrations provide comprehensive monitoring and billing capabilities.
Implementation and Usage
Effective implementation of Ceilometer requires proper configuration and integration with other OpenStack services.
Here are key considerations and best practices for utilizing Ceilometer effectively.
Basic Setup
| Component | Description | Configuration |
|---|---|---|
| API Service | Ceilometer API endpoint |
|
| Agents | Metric collection agents |
|
| Storage | Metric storage backend |
|
Common Operations
- Metric Listing:
openstack metric list - Metric Details:
openstack metric show cpu_util - Alarm Creation:
openstack alarm create
These commands are used to manage Ceilometer.
Advanced Configuration (Production Hardening)
Telemetry Stack Options
| Component | Role | When to Use |
|---|---|---|
| Ceilometer | Metric/event collection and notifications | Always (foundation of telemetry) |
| Gnocchi | Time‑series metrics storage and API | Performance/capacity trending at scale |
| Aodh | Threshold alarms and actions | Real‑time alerting on metric thresholds |
| Panko | Event storage/query | Audit/change tracking (optional) |
Performance Tuning
- Sampling Strategy: Right‑size pipeline polling intervals; avoid overly aggressive collection for low‑value metrics
- Batching: Enable batched notifications and bulk writes to reduce DB overhead
- Indexing/Retention: Tune Gnocchi archive policies (granularity, timespan) and retention per metric class
- Agent Footprint: Constrain compute agent plugins to necessary metrics only; disable unused pollsters
- Network: Use separate message bus and storage networks; enable compression where appropriate
High Availability (HA)
| Layer | Recommendation | Notes |
|---|---|---|
| API | 2+ API nodes behind L7 load balancer | Stateless; health checks and rate limits |
| Agents | Multiple compute/central/notification agents | Idempotent; safe to run in parallel |
| Message Bus | HA RabbitMQ (quorum queues) | Monitor queue depth, consumers |
| Storage | Gnocchi with HA backend (Ceph/Swift) | Archive policy per SLO and cost |
Security & Compliance
- Keystone scoped tokens and minimal roles for telemetry services
- TLS for APIs and message bus; restrict management networks (RBAC on queues)
- PII handling in events/logs; redact sensitive fields before persistence
- Retention policies per compliance (e.g., shorter for detailed metrics)
Observability & Billing
- Operational Metrics: Collector throughput, dropped samples, bus lag, API latency
- Dashboards: Create Grafana/Kibana views for tenant usage, noisy neighbors, trending
- Billing Pipeline: Export Gnocchi aggregates to CloudKitty for rating; validate with sample tenants
- Capacity Planning: Track metric cardinality growth and storage utilization vs archive policy
Troubleshooting Playbook (Quick Checks)
- No Metrics Ingested: Verify notification topics, bus permissions, pollster configs
- High Latency: Inspect message bus health, storage IOPS, archive policy granularity
- Missing Tenant Data: Check Keystone scope/project IDs and agent credentials
- Alarm Not Firing: Validate Aodh rule, aggregation method, and evaluation interval
Key Points
-
Core Functionality
- Resource monitoring
- Event tracking
- Alarm management
- Billing integration -
Key Features
- Metric collection
- Event processing
- Alert generation
- Data storage -
Best Practices
- Proper agent configuration
- Storage optimization
- Alarm management
- Service integration


Comments