9 min to read
Grafana Installation Guide (Helm-based)
Step-by-step process for installing and configuring Grafana in Kubernetes
Overview
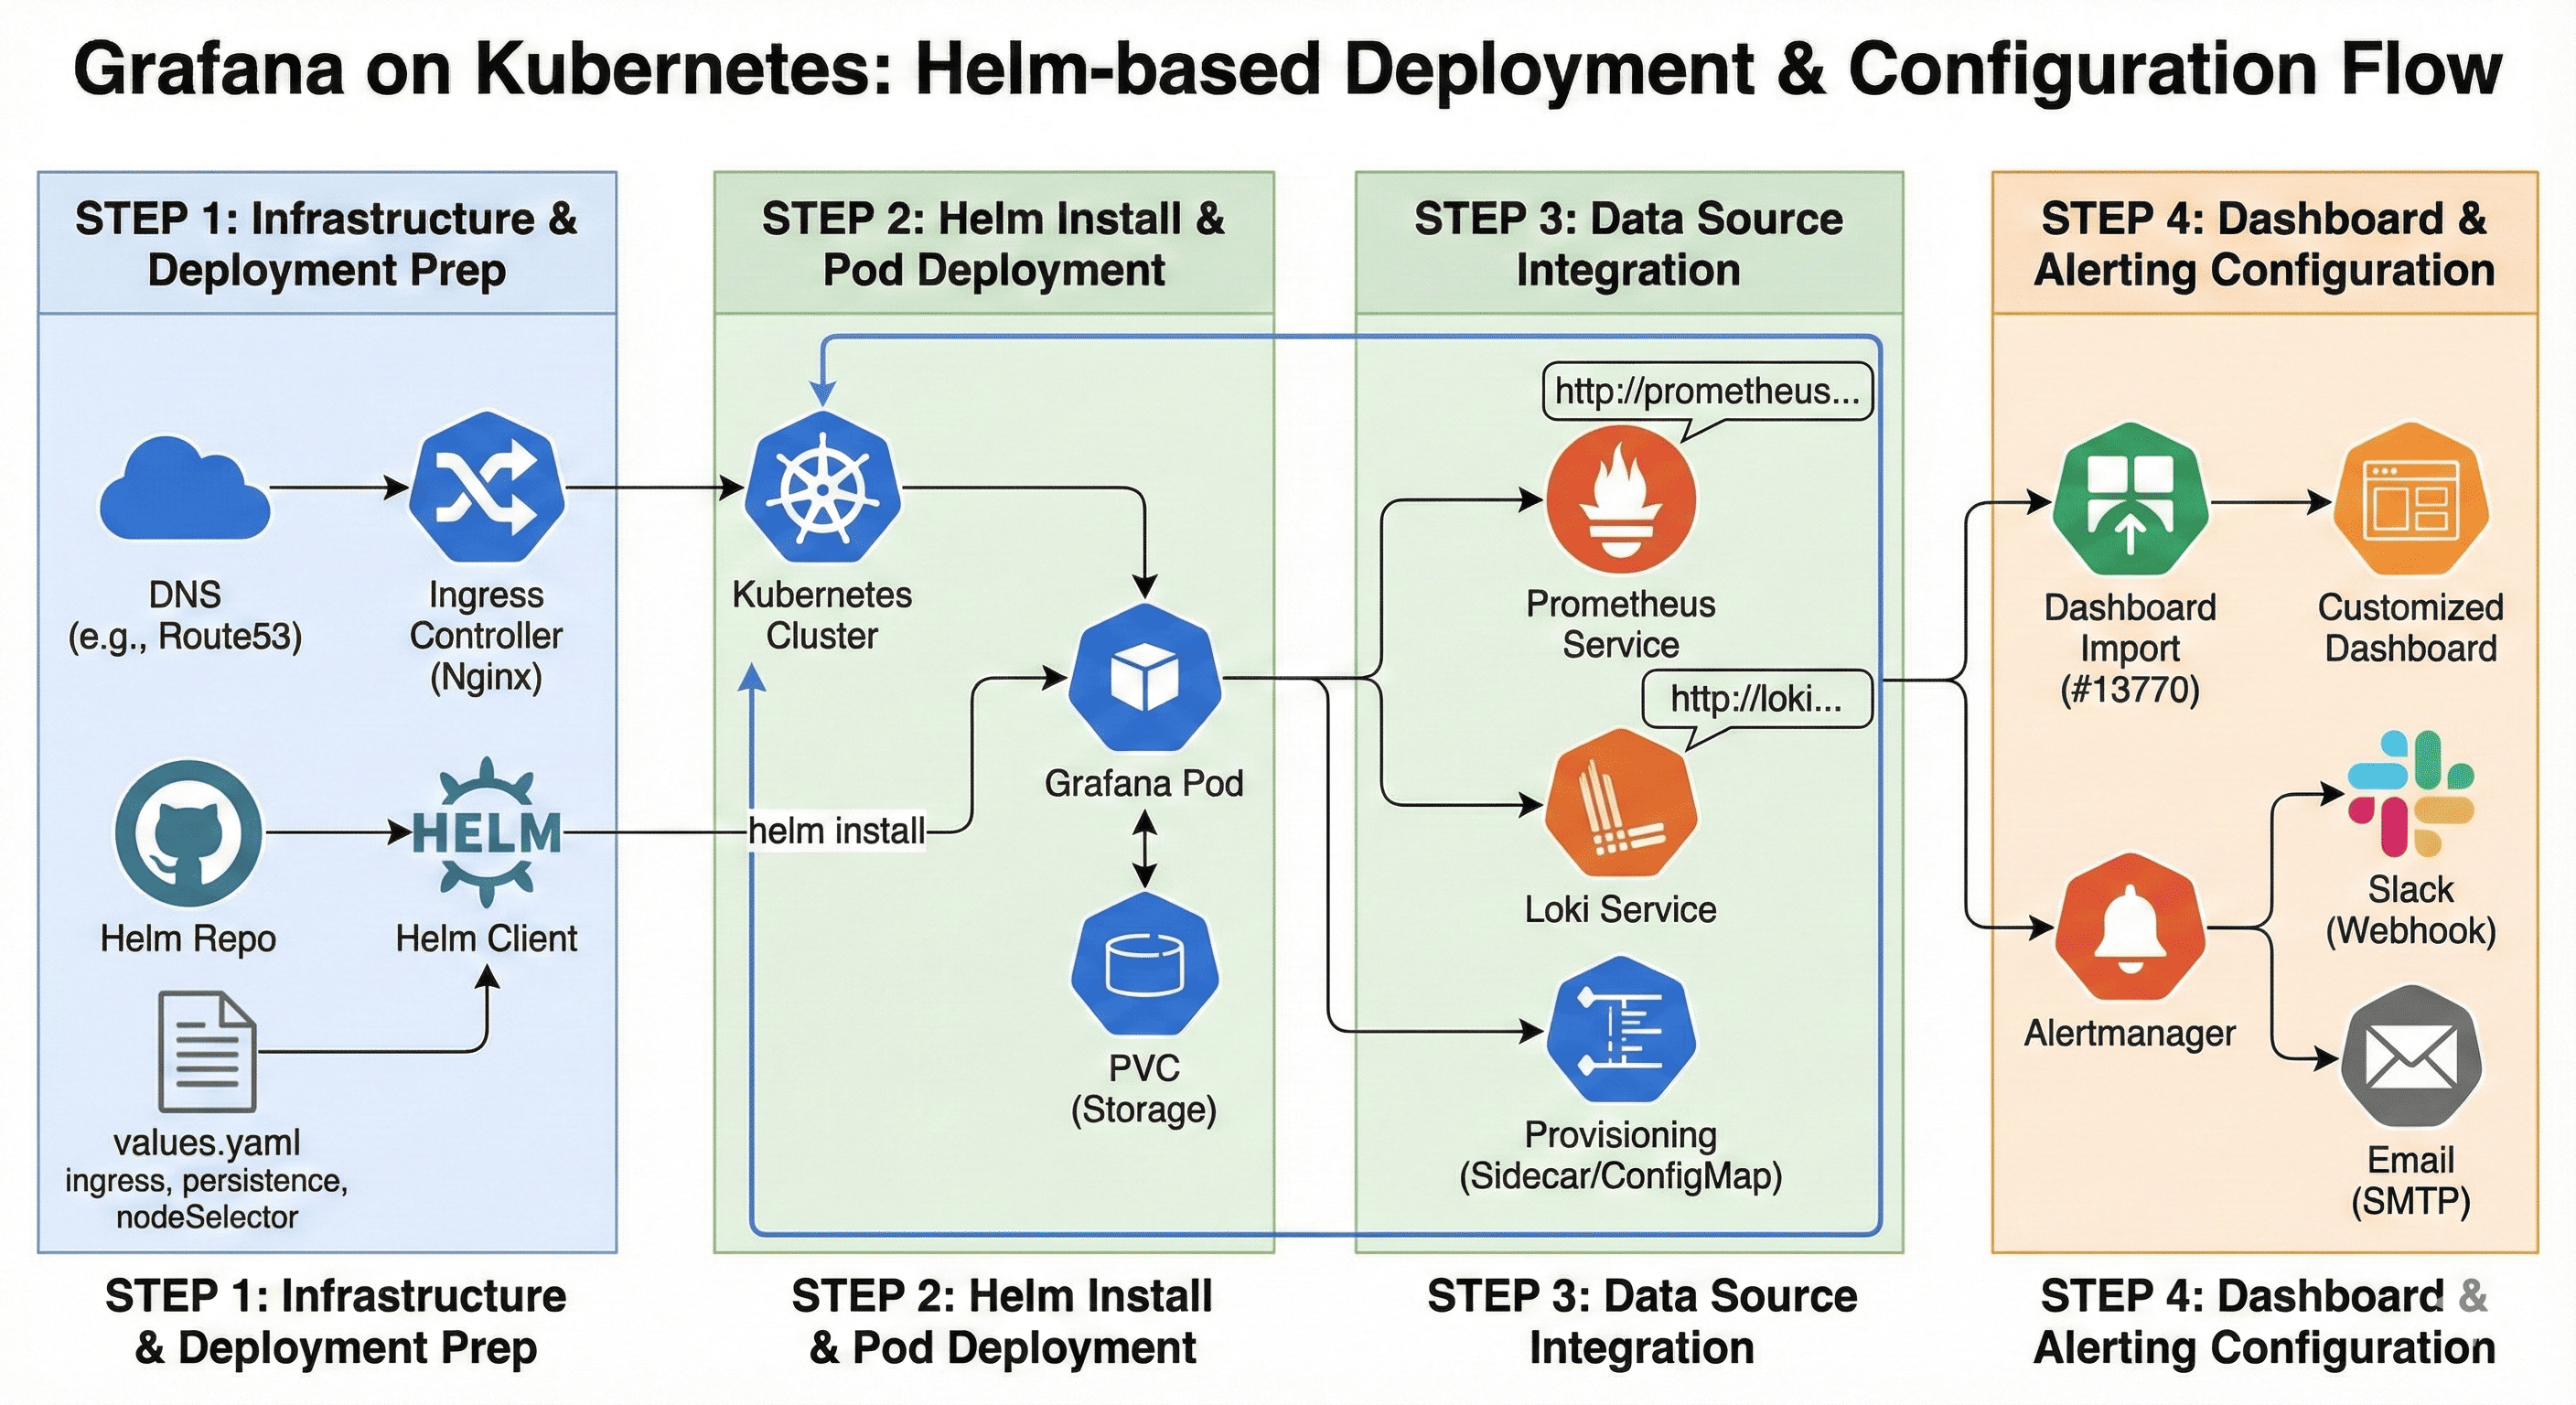
Grafana is an essential tool in DevOps environments for visualizing cluster status and automating alerts. It’s particularly useful in Kubernetes environments where Helm can be leveraged for quick deployment and maintenance. This guide will walk through the process of installing Grafana using Helm Charts, from DNS configuration to dashboard customization.
Grafana Installation Guide (Helm-based)
This document is based on the latest versions of Helm Charts as of 2024.08-09. We’ll cover the complete process from preparation to advanced configuration options.
1️⃣ DNS Record Configuration
If you’ve configured Ingress for external access to Grafana, DNS configuration is necessary. Typically set up in DNS registration services like Route53, Gabia, or Cafe24.
2️⃣ Preparing the Helm Chart
First, you need to add the Grafana Helm repository and update your local Helm cache to ensure you have access to the latest charts. Run the following commands:
# Register Helm Chart Repository
helm repo add grafana https://grafana.github.io/helm-charts
helm repo update
Next, clone the Grafana Helm charts repository to customize the installation according to your requirements:
# Copy the Chart
git clone https://github.com/grafana/helm-charts.git
cp -r helm-charts/charts/grafana .
cd grafana
Finally, update the dependencies to ensure all required components are available:
# Update Dependencies
helm dependency update .
These steps prepare the Helm chart for customization and deployment in your Kubernetes environment.
3️⃣ Create and Configure Values File (values/mgmt.yaml)
This example shows values for an on-premise Ingress-Nginx-Controller configuration. Create a file called values/mgmt.yaml with the following content:
replicas: 1
adminUser: admin
adminPassword: admin

service:
  type: ClusterIP

ingress:
  enabled: true
  ingressClassName: nginx
  hosts:
    - grafana-somaz.link
  annotations:
    nginx.ingress.kubernetes.io/force-ssl-redirect: "true"
    nginx.ingress.kubernetes.io/backend-protocol: "HTTP"

persistence:
  enabled: true
  storageClassName: default
  size: 10Gi

tolerations:
  - key: "monitoring"
    operator: "Equal"
    effect: "NoSchedule"

nodeSelector:
  local-path: enabled
This configuration provides basic Grafana + Ingress + PVC setup. You can expand it with datasources, dashboards, and sidecars as needed. We’ve specified a Monitoring Node and are using its storage space, which is why we’ve included tolerations and nodeSelector to target the appropriate node.
4️⃣ Installation Execution
Before installing Grafana, it’s a good practice to validate your configuration and preview what will be deployed:
# Pre-installation Checks
helm lint --values ./values/mgmt.yaml
helm install grafana . -n monitoring -f ./values/mgmt.yaml --create-namespace --dry-run >> output.yaml
Once you’ve verified that everything looks good, proceed with the actual installation:
# Installation
helm install grafana . -n monitoring -f ./values/mgmt.yaml --create-namespace
⚠️ For future updates to your Grafana deployment, use the upgrade command:
helm upgrade grafana . -n monitoring -f ./values/mgmt.yaml
5️⃣ Accessing Grafana
After installation, access via:
https://grafana-mgmt-cluster.sia-service.kr
Default login credentials are admin/admin, and you’ll be prompted to change the password on first login.
6️⃣ Dashboard Import & Customization (Optional)
Recommended Dashboard: #13770 (Kubernetes All-in-One)
Since this is an older dashboard, you’ll need to modify queries to match the latest Prometheus setup. Data Source registration must be completed before proceeding.
Query Modification Examples (for Production Environment)
CPU Utilization:
- irate(node_cpu_seconds_total{mode!~"guest.*|idle|iowait", kubernetes_node="$node"}[5m])
+ irate(node_cpu_seconds_total{instance="$instance", mode!~"guest.*|idle|iowait"}[5m])
Memory Usage:
- node_memory_MemTotal_bytes{kubernetes_node="m-k8s"} - node_memory_MemAvailable_bytes{kubernetes_node="m-k8s"}
+ node_memory_MemTotal_bytes{instance="$instance"} - node_memory_MemAvailable_bytes{instance="$instance"}
Three Essential Configurations After Grafana Installation
After installing Grafana, these three configurations are essential for a production-ready monitoring setup. They ensure proper data visualization, alerting capabilities, and dashboard management.
1-1. Data Source Registration (Loki & Prometheus)
Prometheus Registration
To register Prometheus as a data source, add the following to your Grafana values file:
datasources:
  datasources.yaml:
    apiVersion: 1
    datasources:
      - name: Prometheus
        type: prometheus
        url: http://prometheus.monitoring.svc.cluster.local:9090
        access: proxy
        isDefault: true
Loki Registration
To add Loki as a data source, include this configuration in the same datasources section:
      - name: Loki
        type: loki
        url: http://loki-gateway.monitoring.svc.cluster.local
        access: proxy
        isDefault: false
Important: The URL should be set to a service address accessible within the cluster. After registration, you can verify in the Grafana UI under [Settings] → [Data Sources].
1-2. Console-Based Data Source Registration (Prometheus & Loki)
Prometheus Registration (UI-based)
- Grafana login → Click Gear(⚙) icon → Data Sources
- → Click Add data source button
- → Select Prometheus
- → Enter URL:
http://prometheus.monitoring.svc.cluster.local:9090 - → Click Save & Test
Loki Registration (UI-based)
- → Add data source → Select Loki
- → Enter URL:
http://loki-gateway.monitoring.svc.cluster.local - → Click Save & Test
Data sources configured via the console are stored in grafana.db. For persistent deployment, it’s more stable to transition to Helm values or ConfigMap methods.
2. Alertmanager Integration (Slack & Email)
1️⃣ Slack Integration Example
To set up Slack notifications from Grafana:
- Generate a Webhook URL in Slack
- Access Alerting > Contact Points menu in Grafana UI
- Select New Contact Point > Slack
- Enter your Webhook URL and configure the alert template
2️⃣ Email Integration Example
For email notifications, add the following to your Grafana values file:
smtp:
  enabled: true
  host: smtp.gmail.com:587
  user: your-email@gmail.com
  password: your-app-password
  fromAddress: grafana@example.com
  fromName: Grafana
Note: For Gmail, you’ll need to use an app-specific password. After setup, configure conditions in Notification policies and connect them to alert rules for automated notifications.
3. Dashboard Automatic Deployment (Provisioning with ConfigMap or sidecar)
Method 1: ConfigMap Approach
Create a ConfigMap containing your dashboard JSON definitions:
apiVersion: v1
kind: ConfigMap
metadata:
  name: grafana-dashboards
  labels:
    grafana_dashboard: "1"
data:
  13770_rev1.json: |
    { ... Dashboard JSON ... }
Then add sidecar configuration to your grafana.values.yaml file:
sidecar:
  dashboards:
    enabled: true
    label: grafana_dashboard
    folder: "K8S Cluster Dashboards"
Method 2: Direct Insertion in Helm values (Sidecar method)
Alternatively, you can specify dashboards directly in your Helm values:
dashboards:
  default:
    kubernetes-cluster:
      file: /var/lib/grafana/dashboards/13770_rev1.json
Both methods automatically load your dashboards into Grafana when deployed.
Advanced Configuration Options
For enterprise deployments, these advanced configurations provide enhanced reliability, security, and resource management capabilities.
High Availability Setup
For critical environments, consider running multiple Grafana instances with pod anti-affinity to ensure they’re distributed across different nodes:
replicas: 3

affinity:
  podAntiAffinity:
    preferredDuringSchedulingIgnoredDuringExecution:
    - weight: 100
      podAffinityTerm:
        labelSelector:
          matchExpressions:
          - key: app.kubernetes.io/name
            operator: In
            values:
            - grafana
        topologyKey: kubernetes.io/hostname
This configuration creates three Grafana replicas and attempts to schedule them on different Kubernetes nodes for better availability.
Enhanced Security Settings
Strengthen your Grafana deployment with these security configurations:
securityContext:
  runAsUser: 472
  runAsGroup: 472
  fsGroup: 472

# Enforcing TLS
grafana.ini:
  server:
    protocol: https
    cert_file: /etc/grafana/tls/tls.crt
    cert_key: /etc/grafana/tls/tls.key
  security:
    disable_initial_admin_creation: false
    cookie_secure: true
    cookie_samesite: lax
These settings enforce proper user permissions, enable HTTPS, and implement secure cookie handling to protect your Grafana instance.
Resource Management
To ensure Grafana performs reliably, allocate appropriate resources:
resources:
  limits:
    cpu: 1000m
    memory: 1Gi
  requests:
    cpu: 500m
    memory: 512Mi
These resource settings provide sufficient CPU and memory allocation for a standard Grafana deployment while preventing it from consuming excessive resources in your cluster.
🔚 Conclusion
This guide has covered installing Grafana via Helm and setting up essential components for cluster operation, including data source connections, alert integration, and automatic dashboard deployment.
To integrate Grafana into a production environment, consider:
- Team-based permission management (Folder/Team Role-based RBAC)
- SAML, LDAP, OAuth-based login integration
- GitOps-based dashboard/alert Git integration
- Granular status-based alert policies
- Integration with Grafana Agent, Mimir, and Tempo
👉 Grafana has evolved beyond a simple visualization tool into an Observability-centered DevOps platform. If this installation and configuration is your first step, I recommend advancing to a more automated, team-scalable operational Grafana infrastructure.

Comments