7 min to read
What is Grafana?
Overview, features, and comparison with other visualization tools
Overview
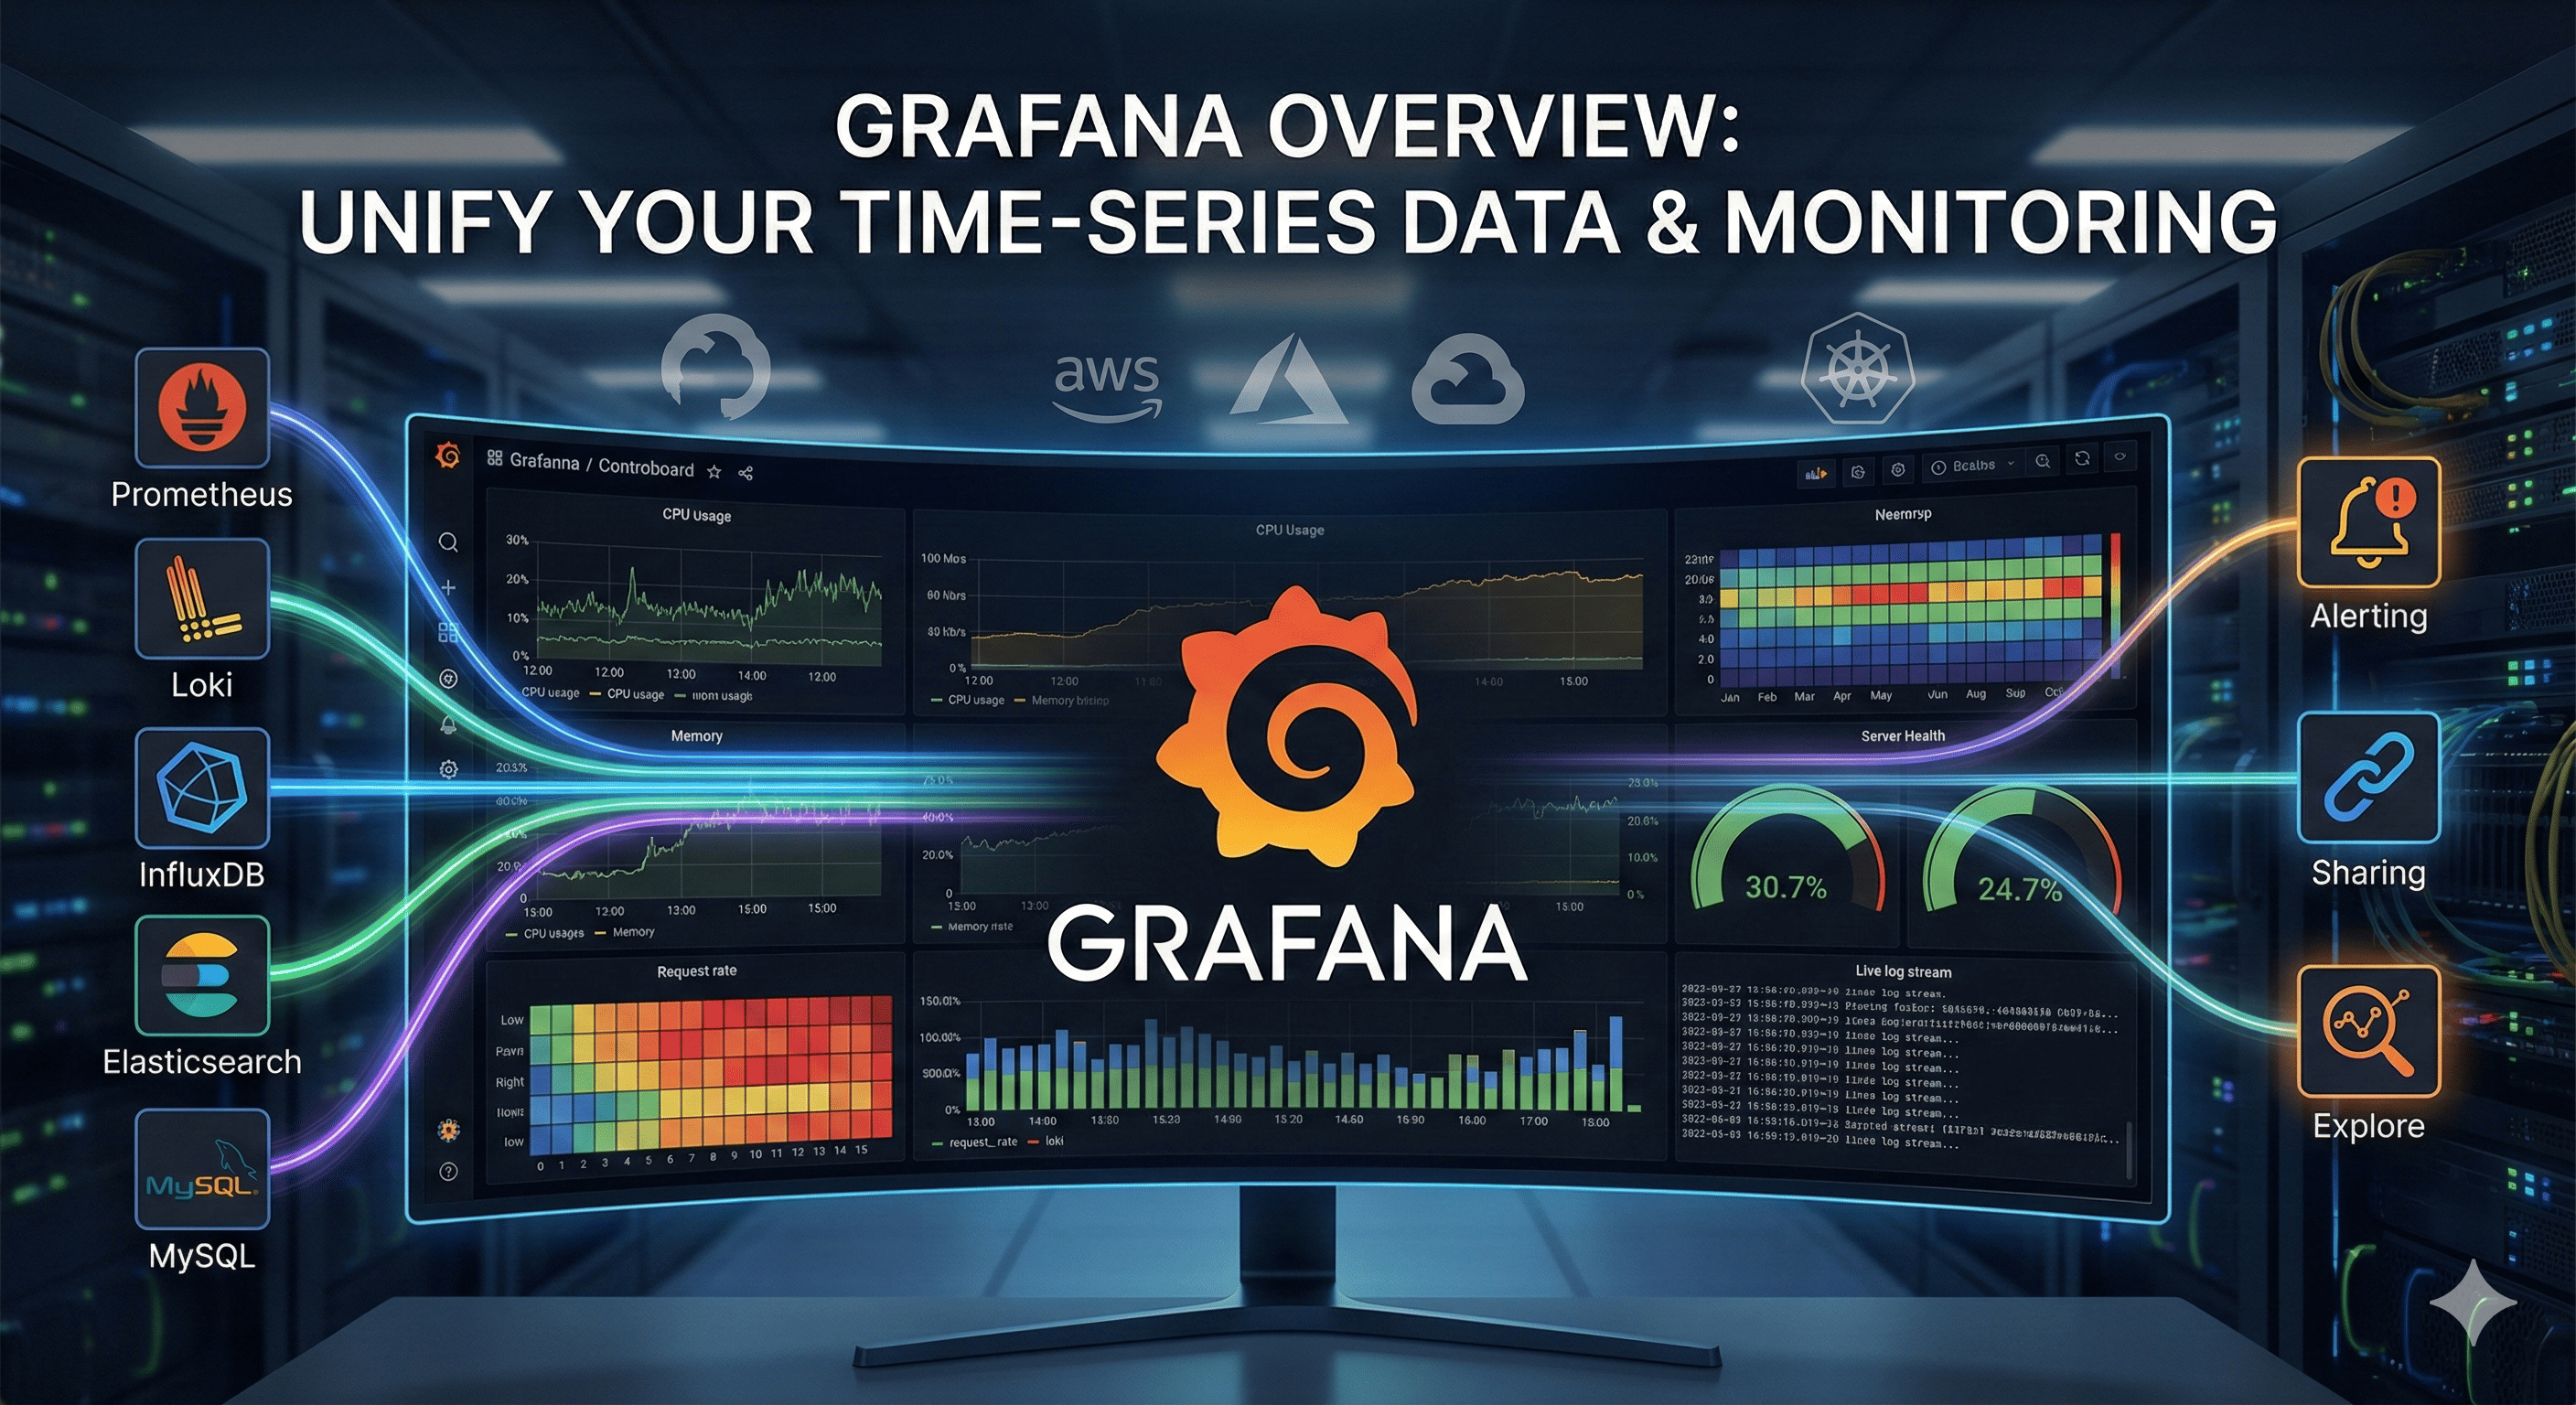
Grafana is an open-source dashboard tool for visualizing and monitoring time-series data.
It connects to various data sources such as Prometheus, Loki, InfluxDB, Elasticsearch, MySQL, and more, enabling intuitive real-time data analysis.
With its integrated dashboard management, Grafana is widely used in DevOps, infrastructure operations, and application monitoring.
What is Grafana?
Grafana is fundamentally a “UI platform for visualizing time-series data.”
However, it has evolved beyond a simple visualization tool into a powerful solution that encompasses monitoring, alerting, data exploration, and sharing capabilities.
Key Features Summary
| Feature | Description |
|---|---|
| Visualization | Utilizes various panels (graphs, tables, gauges, etc.) to represent data |
| Data Source Connection | Supports dozens of sources including Prometheus, Loki, Graphite, InfluxDB, Elasticsearch |
| Alerting | Sends notifications to Slack, Teams, Webhook, etc., when specific conditions are met |
| Dashboard Sharing | Optimized for collaboration with URL, snapshot, and read-only link options |
| User/Permission Management | Configurable view/edit permissions per user (supports LDAP, OAuth authentication) |
| Data Exploration | Query builder + explorer functionality for real-time log and metric queries |
| Plugin Support | Expandable with various community plugins (data sources, panels, etc.) |
Why Use Grafana?
Grafana’s Core Advantages
Native Integration with Prometheus, Loki, Tempo
- Excellent integration with projects created directly by Grafana Labs
Unified DevOps/Observability Platform
- Handle metrics, logs, and traces in a single interface
Cloud/Multi-cloud Friendly
- Connects to AWS CloudWatch, Azure Monitor, GCP Stackdriver, and more
Modular Dashboard Design
- Manageable in JSON format → Easily integrates with GitOps
Open Source + Grafana Cloud Option
- Supports both on-premises and SaaS deployments
Practical Grafana Use Cases
Practical Grafana Applications
- Kubernetes cluster monitoring (node status, pod resources, PV usage, etc.)
- Application metric tracking (error rates, response times, QPS, etc.)
- Log analysis (label-based log filtering with Loki)
- Infrastructure status dashboards (server status, DB, Redis, external APIs, etc.)
- SLA, SLO tracking and alerting
Comparison with Other Visualization Tools
Visualization tools have diverse purposes and functionalities. Here’s how Grafana compares with other major visualization tools in the market.
Note: Scroll horizontally to see all columns in the comparison table.
| Feature | Grafana | Kibana | Tableau | Datadog | Superset |
|---|---|---|---|---|---|
| Primary Purpose | Metrics & log monitoring | Log-centric search & visualization | Business data analysis | Integrated monitoring SaaS | BI visualization (open source) |
| Backend Data | Prometheus, Loki, InfluxDB, and dozens more | Elasticsearch | SQL, Excel, etc. | Internal Agent-based | SQL-based |
| Installation | Lightweight, easy Helm installation | Requires ELK Stack | Requires license | SaaS-focused | Docker/Helm installation |
| Customization | Highly configurable with JSON/YAML | Limited | GUI-focused | Low | Both Python and YAML |
| Plugins | Very diverse ecosystem | Limited | Limited | None | Limited |
| Alert Integration | Slack, Webhook, PagerDuty, etc. | Limited | None | Very powerful | Limited |
| Cost | Free (cloud version available) | Free | Paid | Paid (limited free tier) | Free |
| GitOps Support | Strong (code-based dashboards) | Not supported | Not supported | Not supported | Possible |
| Suitable Fields | DevOps, infrastructure, cloud monitoring | Log analysis | BI dashboard analysis | SaaS-based operational monitoring | Business intelligence |
- Grafana is optimized for viewing metrics/logs/tracing in a single screen
- Kibana focuses on log-centered analysis
- Tableau/Superset are suitable for data analysis (BI)
- Datadog is ideal for commercial SaaS integrated monitoring
🔚 Conclusion: Grafana, the Visualization Tool for the DevOps Era
Grafana is not just a simple graphing tool. It’s an essential DevOps solution that helps monitor the status of all IT stacks—operations, development, security—in a single dashboard and enables quick responses to problems.
Anyone can start using it for free, and its YAML-based dashboard and configuration management make it an excellent choice for GitOps environments.
👉 In the next post, I’ll provide a detailed guide on installing Grafana (Helm-based) and connecting it to Loki/Prometheus data sources. I’ll also cover installation guides and customization tips that can be applied directly in professional environments, so stay tuned!

Comments