36 min to read
Installing Prometheus and Thanos with Helm
Complete guide to deploying, securing, and operating Prometheus and Thanos from basic setup to enterprise-grade production deployments
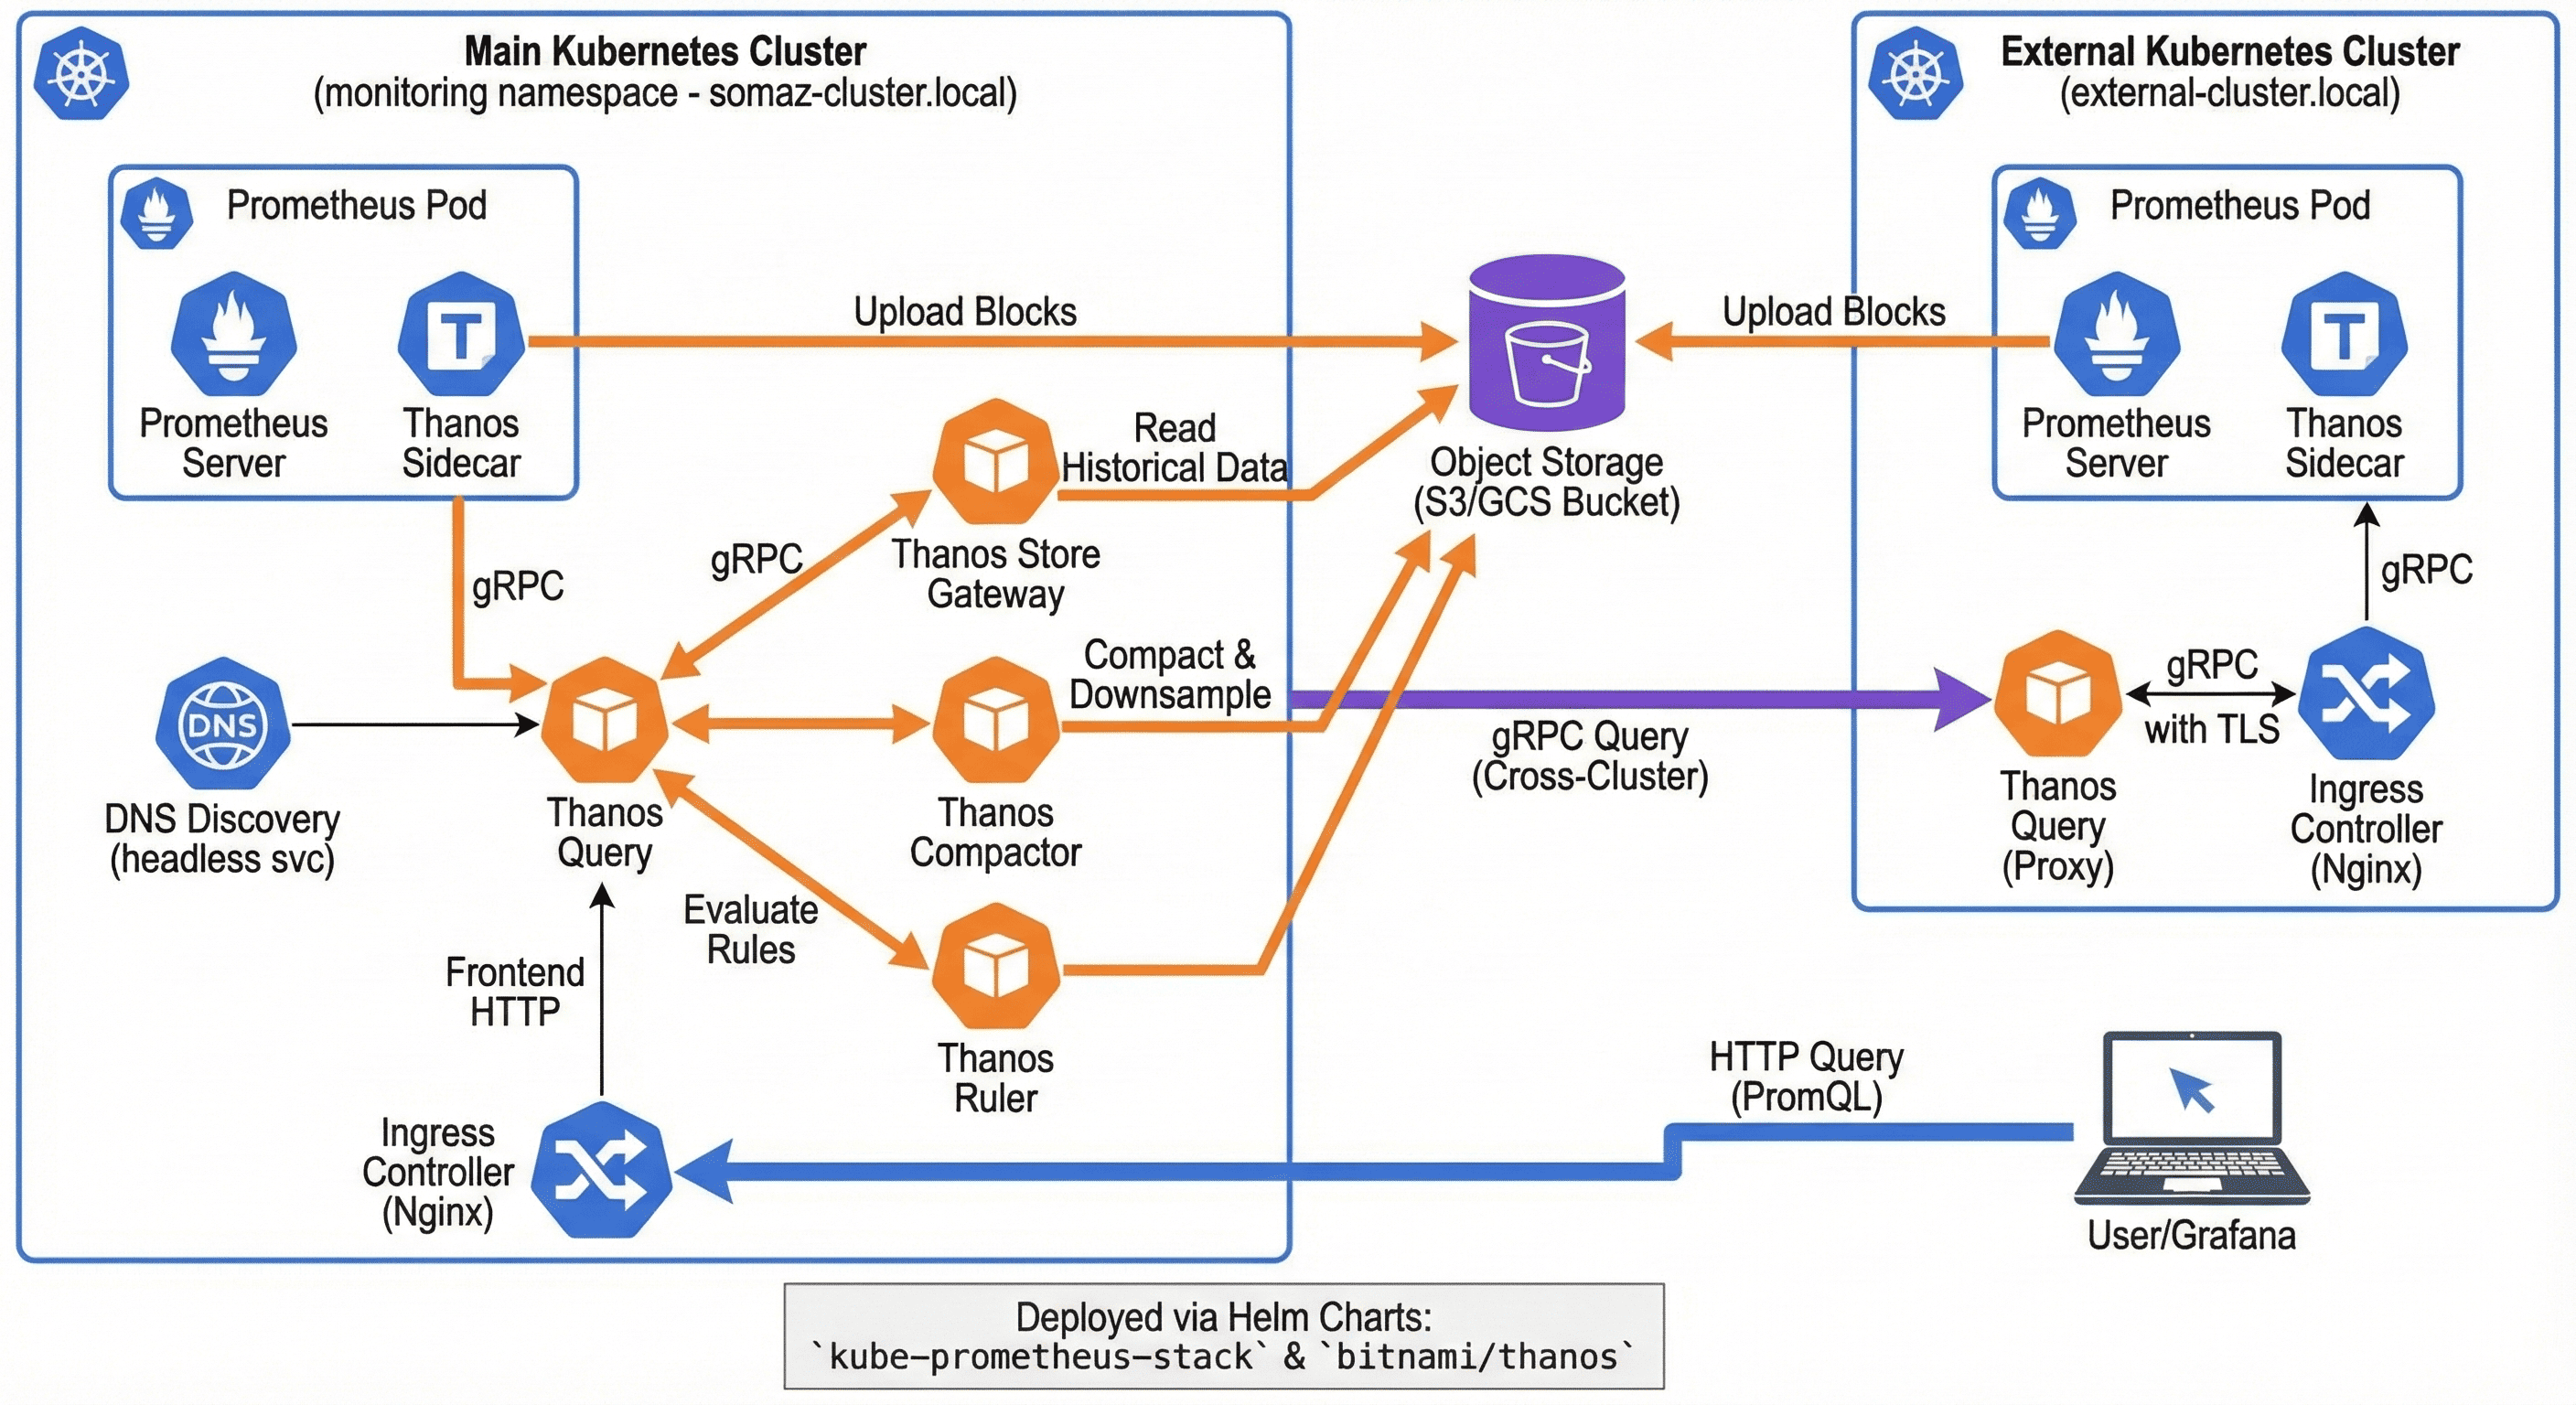
Table of Contents
- Overview and Architecture
- Prerequisites and Planning
- Basic Installation with Helm
- Enterprise Architecture Implementation
- Advanced Configuration and Optimization
- Multi-Cluster Federation
- Security and Compliance
- Performance Optimization
- Operational Excellence
- Disaster Recovery
- Troubleshooting and Best Practices
Overview and Architecture
Enterprise monitoring infrastructure demands sophisticated solutions that can scale across global deployments while maintaining reliability, security, and operational simplicity.
Prometheus and Thanos together form the foundation of modern observability platforms, providing metrics collection, long-term storage, and unified querying capabilities that meet the most demanding enterprise requirements.
Evolution of Enterprise Monitoring
2000-2010] A --> C[Cloud-Native Monitoring
2010-2020] A --> D[Distributed Observability
2020-Present] B --> B1[SNMP/Nagios] B --> B2[Centralized Architecture] B --> B3[Manual Configuration] C --> C1[Prometheus/Grafana] C --> C2[Container Monitoring] C --> C3[Service Discovery] C --> C4[Pull-based Metrics] D --> D1[Multi-Cluster Federation] D --> D2[Long-term Storage] D --> D3[Global Query Layer] D --> D4[Observability as Code] D --> D5[AI-driven Insights]
Core Architecture Components
Global Query Interface] ThanosQueryFrontend[Thanos Query Frontend
Query Optimization] ThanosRuler[Thanos Ruler
Global Alerting] end subgraph "Data Plane Layer" subgraph "Cluster 1" Prom1[Prometheus
Metrics Collection] ThanosReceive1[Thanos Receive
Remote Write] ThanosSidecar1[Thanos Sidecar
Upload Agent] end subgraph "Cluster 2" Prom2[Prometheus
Metrics Collection] ThanosReceive2[Thanos Receive
Remote Write] ThanosSidecar2[Thanos Sidecar
Upload Agent] end end subgraph "Storage Layer" ObjectStorage[(Object Storage
S3/GCS/Azure)] ThanosCompactor[Thanos Compactor
Data Processing] ThanosStore[Thanos Store
Query Gateway] end subgraph "Operational Layer" Grafana[Grafana
Visualization] Alertmanager[Alertmanager
Notification] ServiceMesh[Service Mesh
Istio/Linkerd] end ThanosQuery --> ThanosReceive1 ThanosQuery --> ThanosReceive2 ThanosQuery --> ThanosStore ThanosQueryFrontend --> ThanosQuery ThanosSidecar1 --> ObjectStorage ThanosSidecar2 --> ObjectStorage ThanosReceive1 --> ObjectStorage ThanosReceive2 --> ObjectStorage ThanosCompactor --> ObjectStorage ThanosStore --> ObjectStorage ThanosRuler --> Alertmanager ThanosQueryFrontend --> Grafana
Prerequisites and Planning
Technical Prerequisites
Before implementing your monitoring infrastructure, ensure you have the following components in place:
Infrastructure Requirements:
- Kubernetes Cluster: v1.24+ with proper networking configuration
- Storage Provisioner: For persistent volumes (recommended: SSD-based storage classes)
- Object Storage: S3, GCS, MinIO, or other compatible object storage
- Network Connectivity: Proper ingress configuration and DNS resolution
- Resource Allocation: Adequate CPU, memory, and storage for monitoring workloads
Tool Requirements:
- Helm: Version 3.12+ installed and configured
- kubectl: Properly configured with cluster access
- DNS: Proper DNS configuration for service discovery
- TLS Certificates: For secure communications (recommended)
Access Requirements:
- Object Storage Access: Credentials for chosen storage provider
- Cluster Admin Rights: For installing CRDs and operators
- Network Access: Between clusters for multi-cluster setups
Capacity Planning
Resource Requirements by Deployment Size:
| Deployment Size | Prometheus Resources | Thanos Resources | Storage Requirements |
|---|---|---|---|
| Small (< 1k series) | 2 vCPU, 4GB RAM | 1 vCPU, 2GB RAM | 50GB local, 100GB object |
| Medium (1k-10k series) | 4 vCPU, 8GB RAM | 2 vCPU, 4GB RAM | 200GB local, 1TB object |
| Large (10k-100k series) | 8 vCPU, 16GB RAM | 4 vCPU, 8GB RAM | 500GB local, 10TB object |
| Enterprise (100k+ series) | 16+ vCPU, 32+ GB RAM | 8+ vCPU, 16+ GB RAM | 1TB+ local, 100TB+ object |
Installation Strategy Planning
Choose Your Installation Approach:
| Approach | Use Case | Complexity | Features |
|---|---|---|---|
| Basic Setup | Development, small teams | Low | Core monitoring capabilities |
| Production Ready | Small to medium production | Medium | HA, basic security, retention |
| Enterprise Grade | Large scale, compliance | High | Multi-tenant, federation, advanced security |
Basic Installation with Helm
This section provides step-by-step instructions for installing Prometheus and Thanos using Helm charts, progressing from basic to production-ready configurations.
Preparation Steps
1. Add Required Helm Repositories
# Add Prometheus community repository
helm repo add prometheus-community https://prometheus-community.github.io/helm-charts

# Add Bitnami repository for Thanos
helm repo add bitnami https://charts.bitnami.com/bitnami

# Update repositories
helm repo update

# Verify repositories
helm repo list
2. Create Monitoring Namespace
# Create dedicated namespace for monitoring
kubectl create namespace monitoring

# Set default namespace for convenience
kubectl config set-context --current --namespace=monitoring
3. Install Required CRDs
# Install Prometheus Operator CRDs
helm install prometheus-operator-crds prometheus-community/prometheus-operator-crds --namespace monitoring
Installation Options
Option 1: Basic Prometheus Installation
Use Case: Development environments, getting started
Create values/prometheus-basic.yaml:
# Basic Prometheus configuration
server:
  name: server
  image:
    repository: quay.io/prometheus/prometheus
    tag: latest

  persistentVolume:
    enabled: true
    accessModes:
      - ReadWriteOnce
    storageClass: "default"
    size: 50Gi

  replicaCount: 1
  statefulSet:
    enabled: false

  service:
    enabled: true
    type: ClusterIP

  # Resource limits
  resources:
    requests:
      cpu: 500m
      memory: 1Gi
    limits:
      cpu: 2000m
      memory: 4Gi

# Enable basic components
alertmanager:
  enabled: true
  persistence:
    size: 2Gi

kube-state-metrics:
  enabled: true

prometheus-node-exporter:
  enabled: true

prometheus-pushgateway:
  enabled: false
Installation:
helm install prometheus prometheus-community/prometheus --namespace monitoring --values values/prometheus-basic.yaml --create-namespace
Option 2: Production-Ready with Kube-Prometheus-Stack
Use Case: Production environments with comprehensive monitoring
Create values/kube-prometheus-stack.yaml:
Installation:
helm install kube-prometheus-stack prometheus-community/kube-prometheus-stack --namespace monitoring --values values/kube-prometheus-stack.yaml --create-namespace
Object Storage Configuration
Before installing Thanos, configure object storage for long-term metrics retention.
Create Object Storage Configuration
Create objstore.yml with your storage provider configuration:
For AWS S3:
type: s3
config:
  bucket: "your-thanos-bucket"
  endpoint: "s3.us-west-2.amazonaws.com"
  region: "us-west-2"
  access_key: "YOUR_ACCESS_KEY"
  secret_key: "YOUR_SECRET_KEY"
  insecure: false
  signature_version2: false
  encrypt_sse: true
  put_user_metadata:
    "X-Amz-Acl": "private"
For Google Cloud Storage:
type: gcs
config:
  bucket: "your-thanos-bucket"
  service_account: |
    {
      "type": "service_account",
      "project_id": "your-project",
      "private_key_id": "...",
      "private_key": "...",
      "client_email": "...",
      "client_id": "...",
      "auth_uri": "https://accounts.google.com/o/oauth2/auth",
      "token_uri": "https://oauth2.googleapis.com/token"
    }
For MinIO (Development/Testing):
type: s3
config:
  bucket: "thanos"
  endpoint: "minio.storage.svc.cluster.local:9000"
  access_key: "minioadmin"
  secret_key: "minioadmin"
  insecure: true
  signature_version2: false
Create Kubernetes Secret
# Create the object storage secret
kubectl create secret generic thanos-objstore --from-file=objstore.yml --namespace monitoring
Thanos Installation
Single-Cluster Thanos Configuration
Create values/thanos-single-cluster.yaml:
# Global configuration
global:
  storageClass: "fast-ssd"
  imageRegistry: "quay.io"

# Cluster domain configuration
clusterDomain: cluster.local
fullnameOverride: "thanos"

# Object storage configuration
existingObjstoreSecret: "thanos-objstore"

# Query component configuration
query:
  enabled: true
  logLevel: info

  # Replica labels for deduplication
  replicaLabel:
    - prometheus_replica
    - __replica__

  # Store endpoints
  stores:
    - dnssrv+_grpc._tcp.kube-prometheus-stack-thanos-discovery.monitoring.svc.cluster.local

  # Resource allocation
  resources:
    requests:
      cpu: 500m
      memory: 1Gi
    limits:
      cpu: 2000m
      memory: 4Gi

  # Service configuration
  service:
    type: ClusterIP
    ports:
      http: 9090
      grpc: 10901

  # Ingress configuration
  ingress:
    enabled: true
    ingressClassName: nginx
    hostname: thanos-query.your-domain.com
    annotations:
      nginx.ingress.kubernetes.io/ssl-redirect: "true"
    tls: true
    extraTls:
    - hosts:
      - thanos-query.your-domain.com
      secretName: thanos-query-tls

# Query Frontend component
queryFrontend:
  enabled: true

  # Resource allocation
  resources:
    requests:
      cpu: 500m
      memory: 1Gi
    limits:
      cpu: 1000m
      memory: 2Gi

  # Configuration
  config: |
    type: in-memory
    config:
      max_size: 256MB
      validity: 24h

  # Ingress configuration
  ingress:
    enabled: true
    ingressClassName: nginx
    hostname: thanos.your-domain.com
    annotations:
      nginx.ingress.kubernetes.io/ssl-redirect: "true"
    tls: true

# Compactor component
compactor:
  enabled: true

  # Retention configuration
  retentionResolutionRaw: 30d      # Raw data retention
  retentionResolution5m: 90d       # 5-minute downsampled data
  retentionResolution1h: 2y        # 1-hour downsampled data

  # Resource allocation
  resources:
    requests:
      cpu: 1000m
      memory: 2Gi
    limits:
      cpu: 2000m
      memory: 4Gi

  # Persistence configuration
  persistence:
    enabled: true
    storageClass: "fast-ssd"
    size: 20Gi

  # Compaction configuration
  config: |
    compactor:
      sync-delay: 30m
      retention-resolution-raw: 30d
      retention-resolution-5m: 90d
      retention-resolution-1h: 2y
      wait: true
      block-sync-concurrency: 20
      compact-concurrency: 1
      downsample-concurrency: 1

# Store Gateway component
storegateway:
  enabled: true

  # Resource allocation
  resources:
    requests:
      cpu: 500m
      memory: 2Gi
    limits:
      cpu: 2000m
      memory: 8Gi

  # Persistence for caching
  persistence:
    enabled: true
    storageClass: "fast-ssd"
    size: 50Gi

  # Configuration
  config: |
    store:
      sync-block-duration: 3m
      block-sync-concurrency: 20
      index-cache-size: 1GB
      chunk-pool-size: 2GB

# Ruler component (optional)
ruler:
  enabled: false  # Enable if you need global alerting rules

  # Alertmanager configuration
  alertmanagers:
    - http://kube-prometheus-stack-alertmanager.monitoring.svc.cluster.local:9093

  # Evaluation interval
  evalInterval: 15s

  # Resource allocation
  resources:
    requests:
      cpu: 500m
      memory: 1Gi
    limits:
      cpu: 1000m
      memory: 2Gi

# Receive component (optional for remote write)
receive:
  enabled: false  # Enable for remote write scenarios
Install Thanos
helm install thanos bitnami/thanos --namespace monitoring --values values/thanos-single-cluster.yaml
Verification and Basic Testing
Check Installation Status
# Check all monitoring pods
kubectl get pods -n monitoring

# Check services
kubectl get svc -n monitoring

# Check ingresses
kubectl get ingress -n monitoring
Verify Component Health
# Check Prometheus health
kubectl port-forward svc/kube-prometheus-stack-prometheus 9090:9090 -n monitoring &
curl http://localhost:9090/-/healthy

# Check Thanos Query health
kubectl port-forward svc/thanos-query 9090:9090 -n monitoring &
curl http://localhost:9090/-/healthy

# Check Thanos Store health
kubectl port-forward svc/thanos-storegateway 10902:10902 -n monitoring &
curl http://localhost:10902/-/healthy
Test Metric Queries
Access Thanos Query UI and verify:
- Basic connectivity: Navigate to Thanos Query UI
- Store status: Check the “Stores” page to verify all stores are connected
- Query functionality: Run simple queries like
uporprometheus_build_info - Data availability: Verify metrics from different time ranges
Enterprise Architecture Implementation
Once you have a basic setup running, you can evolve your monitoring infrastructure to meet enterprise requirements. This section covers advanced architectural patterns and configurations.
Multi-Tenancy Implementation
Tenant Isolation Strategy
Create values/prometheus-multitenant.yaml:
# Multi-tenant Prometheus configuration
global:
  # Tenant-specific external labels
  external_labels:
    tenant: "${TENANT_ID}"
    cluster: "${CLUSTER_NAME}"
    environment: "${ENVIRONMENT}"

prometheus:
  prometheusSpec:
    # Tenant-specific configuration
    externalLabels:
      tenant: tenant-a
      cluster: production-east
      environment: prod

    # Resource isolation per tenant
    resources:
      requests:
        memory: "4Gi"
        cpu: "2000m"
      limits:
        memory: "16Gi"
        cpu: "8000m"

    # Storage isolation
    storageSpec:
      volumeClaimTemplate:
        spec:
          storageClassName: premium-ssd
          resources:
            requests:
              storage: 200Gi

    # Service monitoring scoped to tenant
    serviceMonitorSelector:
      matchLabels:
        tenant: tenant-a

    podMonitorSelector:
      matchLabels:
        tenant: tenant-a

    # Security context
    securityContext:
      runAsNonRoot: true
      runAsUser: 65534
      fsGroup: 65534

    # Network policies for isolation
    podMetadata:
      labels:
        tenant: tenant-a
        monitoring: prometheus
Network Isolation
Create network-policies/tenant-isolation.yaml:
apiVersion: networking.k8s.io/v1
kind: NetworkPolicy
metadata:
  name: tenant-prometheus-isolation
  namespace: monitoring
spec:
  podSelector:
    matchLabels:
      tenant: tenant-a
  policyTypes:
  - Ingress
  - Egress

  ingress:
  # Allow ingress from ingress controllers
  - from:
    - namespaceSelector:
        matchLabels:
          name: ingress-nginx
    ports:
    - protocol: TCP
      port: 9090

  # Allow inter-component communication within monitoring namespace
  - from:
    - namespaceSelector:
        matchLabels:
          name: monitoring
    - podSelector:
        matchLabels:
          tenant: tenant-a
    ports:
    - protocol: TCP
      port: 9090
    - protocol: TCP
      port: 10901

  egress:
  # Allow DNS resolution
  - to: []
    ports:
    - protocol: UDP
      port: 53
    - protocol: TCP
      port: 53

  # Allow HTTPS to object storage
  - to: []
    ports:
    - protocol: TCP
      port: 443

  # Allow communication to tenant-specific targets
  - to:
    - namespaceSelector:
        matchLabels:
          tenant: tenant-a
High Availability Configuration
HA Prometheus Setup
Create values/prometheus-ha.yaml:
prometheus:
  prometheusSpec:
    # High availability with multiple replicas
    replicas: 3

    # Pod disruption budget
    podDisruptionBudget:
      enabled: true
      minAvailable: 2

    # Anti-affinity for spreading across nodes
    affinity:
      podAntiAffinity:
        requiredDuringSchedulingIgnoredDuringExecution:
        - labelSelector:
            matchExpressions:
            - key: app.kubernetes.io/name
              operator: In
              values:
              - prometheus
          topologyKey: kubernetes.io/hostname
        - labelSelector:
            matchExpressions:
            - key: app.kubernetes.io/name
              operator: In
              values:
              - prometheus
          topologyKey: topology.kubernetes.io/zone

    # Node selector for dedicated monitoring nodes
    nodeSelector:
      node-role: monitoring

    # Tolerations for monitoring nodes
    tolerations:
    - key: monitoring
      operator: Equal
      value: "true"
      effect: NoSchedule

    # Resource allocation for HA setup
    resources:
      requests:
        cpu: 4000m
        memory: 8Gi
      limits:
        cpu: 8000m
        memory: 16Gi

    # Sharding configuration for large scale
    shards: 2
HA Thanos Configuration
Create values/thanos-ha.yaml:
# High Availability Thanos configuration
query:
  enabled: true
  replicaCount: 3

  # Resource allocation
  resources:
    requests:
      cpu: 2000m
      memory: 4Gi
    limits:
      cpu: 4000m
      memory: 8Gi

  # Anti-affinity configuration
  affinity:
    podAntiAffinity:
      preferredDuringSchedulingIgnoredDuringExecution:
      - weight: 100
        podAffinityTerm:
          labelSelector:
            matchExpressions:
            - key: app.kubernetes.io/name
              operator: In
              values:
              - thanos
            - key: app.kubernetes.io/component
              operator: In
              values:
              - query
          topologyKey: kubernetes.io/hostname

  # Pod disruption budget
  podDisruptionBudget:
    enabled: true
    minAvailable: 2

storegateway:
  enabled: true
  replicaCount: 3

  # Sharding configuration
  sharding:
    enabled: true

  # Resource allocation for HA
  resources:
    requests:
      cpu: 2000m
      memory: 8Gi
    limits:
      cpu: 4000m
      memory: 16Gi

  # Anti-affinity for distribution
  affinity:
    podAntiAffinity:
      preferredDuringSchedulingIgnoredDuringExecution:
      - weight: 100
        podAffinityTerm:
          labelSelector:
            matchExpressions:
            - key: app.kubernetes.io/component
              operator: In
              values:
              - storegateway
          topologyKey: kubernetes.io/hostname

compactor:
  enabled: true

  # Single instance for compactor (stateful)
  replicaCount: 1

  # Leader election for HA
  config: |
    compactor:
      consistency-delay: 30m
      wait: true
      block-sync-concurrency: 20
Advanced Configuration and Optimization
Performance Tuning
Prometheus Performance Configuration
Create values/prometheus-performance.yaml:
prometheus:
  prometheusSpec:
    # Performance optimizations
    additionalArgs:
    - --web.enable-lifecycle
    - --web.enable-admin-api
    - --storage.tsdb.min-block-duration=2h
    - --storage.tsdb.max-block-duration=2h
    - --storage.tsdb.wal-compression
    - --query.max-concurrency=50
    - --query.max-samples=50000000
    - --storage.tsdb.retention.time=15d
    - --storage.tsdb.retention.size=45GB

    # WAL configuration
    walCompression: true

    # Resource allocation for high performance
    resources:
      requests:
        cpu: 8000m
        memory: 16Gi
      limits:
        cpu: 16000m
        memory: 32Gi

    # Storage optimization
    storageSpec:
      volumeClaimTemplate:
        spec:
          storageClassName: premium-nvme
          accessModes: ["ReadWriteOnce"]
          resources:
            requests:
              storage: 500Gi

    # Scrape configuration optimization
    scrapeInterval: 15s
    evaluationInterval: 15s

    # Query optimization
    queryLogFile: /prometheus/query.log

    # Remote write configuration for Thanos Receive
    remoteWrite:
    - url: http://thanos-receive.monitoring.svc.cluster.local:19291/api/v1/receive
      writeRelabelConfigs:
      - sourceLabels: [__name__]
        regex: 'go_.*|process_.*|prometheus_.*'
        action: drop
Advanced Recording Rules
Create rules/performance-rules.yaml:
apiVersion: monitoring.coreos.com/v1
kind: PrometheusRule
metadata:
  name: performance-recording-rules
  namespace: monitoring
spec:
  groups:
  - name: instance.rules
    interval: 30s
    rules:
    # CPU utilization by instance
    - record: instance:cpu_utilization:rate5m
      expr: |
        (
          1 - avg by (instance) (
            rate(node_cpu_seconds_total{mode="idle"}[5m])
          )
        ) * 100

    # Memory utilization by instance
    - record: instance:memory_utilization:ratio
      expr: |
        (
          1 - (
            node_memory_MemAvailable_bytes / node_memory_MemTotal_bytes
          )
        ) * 100

    # Disk utilization by instance and device
    - record: instance:disk_utilization:ratio
      expr: |
        (
          1 - (
            node_filesystem_avail_bytes{fstype!~"tmpfs|fuse.lxcfs"} /
            node_filesystem_size_bytes{fstype!~"tmpfs|fuse.lxcfs"}
          )
        ) * 100

    # Network throughput by instance
    - record: instance:network_throughput:rate5m
      expr: |
        sum by (instance) (
          rate(node_network_receive_bytes_total[5m]) +
          rate(node_network_transmit_bytes_total[5m])
        )

  - name: application.rules
    interval: 30s
    rules:
    # Application request rate
    - record: application:request_rate:rate5m
      expr: |
        sum by (service, namespace) (
          rate(http_requests_total[5m])
        )

    # Application error rate
    - record: application:error_rate:rate5m
      expr: |
        sum by (service, namespace) (
          rate(http_requests_total{status=~"5.."}[5m])
        ) / sum by (service, namespace) (
          rate(http_requests_total[5m])
        ) * 100

    # Application response time p99
    - record: application:response_time:p99
      expr: |
        histogram_quantile(0.99,
          sum by (service, namespace, le) (
            rate(http_request_duration_seconds_bucket[5m])
          )
        )

  - name: cluster.rules
    interval: 60s
    rules:
    # Cluster CPU utilization
    - record: cluster:cpu_utilization:rate5m
      expr: |
        avg(instance:cpu_utilization:rate5m)

    # Cluster memory utilization
    - record: cluster:memory_utilization:ratio
      expr: |
        (
          sum(node_memory_MemTotal_bytes - node_memory_MemAvailable_bytes) /
          sum(node_memory_MemTotal_bytes)
        ) * 100

    # Cluster network throughput
    - record: cluster:network_throughput:rate5m
      expr: |
        sum(instance:network_throughput:rate5m)
Thanos Performance Optimization
Create values/thanos-performance.yaml:
query:
  enabled: true

  # Performance configuration
  extraArgs:
  - --query.timeout=15m
  - --query.max-concurrent=100
  - --query.lookback-delta=15m
  - --query.auto-downsampling
  - --query.partial-response
  - --query.max-concurrent-select=16
  - --store.unhealthy-timeout=5m
  - --store.response-timeout=30s

  # Resource allocation for high performance
  resources:
    requests:
      cpu: 4000m
      memory: 8Gi
    limits:
      cpu: 8000m
      memory: 16Gi

queryFrontend:
  enabled: true

  # Query optimization configuration
  extraArgs:
  - --query-range.split-interval=24h
  - --query-range.max-retries-per-request=3
  - --query-range.request-downsampled
  - --query-range.partial-response
  - --query-frontend.align-range-with-step
  - --query-frontend.split-queries-by-interval=24h
  - --query-frontend.cache-unaligned-requests

  # Caching configuration
  config: |
    type: redis
    config:
      addr: "redis-cluster.monitoring.svc.cluster.local:6379"
      password: "${REDIS_PASSWORD}"
      db: 0
      pool_size: 100
      min_idle_conns: 10
      dial_timeout: 5s
      read_timeout: 3s
      write_timeout: 3s
      expiration: 24h

storegateway:
  enabled: true

  # Performance optimization
  extraArgs:
  - --sync-block-duration=3m
  - --block-sync-concurrency=20
  - --index-cache-size=4GB
  - --chunk-pool-size=4GB
  - --store.grpc.series-sample-limit=120000
  - --store.grpc.series-max-concurrency=50

  # Resource allocation for high performance
  resources:
    requests:
      cpu: 4000m
      memory: 16Gi
    limits:
      cpu: 8000m
      memory: 32Gi

compactor:
  enabled: true

  # Compaction optimization
  extraArgs:
  - --block-files-concurrency=8
  - --compact-concurrency=4
  - --downsample-concurrency=4
  - --delete-delay=48h

  # Resource allocation
  resources:
    requests:
      cpu: 4000m
      memory: 8Gi
    limits:
      cpu: 8000m
      memory: 16Gi
Horizontal Pod Autoscaling
Create hpa/thanos-query-hpa.yaml:
apiVersion: autoscaling/v2
kind: HorizontalPodAutoscaler
metadata:
  name: thanos-query-hpa
  namespace: monitoring
spec:
  scaleTargetRef:
    apiVersion: apps/v1
    kind: Deployment
    name: thanos-query
  minReplicas: 3
  maxReplicas: 20
  metrics:
  # CPU-based scaling
  - type: Resource
    resource:
      name: cpu
      target:
        type: Utilization
        averageUtilization: 70

  # Memory-based scaling
  - type: Resource
    resource:
      name: memory
      target:
        type: Utilization
        averageUtilization: 80

  # Custom metric: Query latency
  - type: Pods
    pods:
      metric:
        name: thanos_query_duration_seconds_p99
      target:
        type: AverageValue
        averageValue: "5"

  behavior:
    scaleUp:
      stabilizationWindowSeconds: 300
      policies:
      - type: Percent
        value: 100
        periodSeconds: 60
      - type: Pods
        value: 4
        periodSeconds: 60
      selectPolicy: Max
    scaleDown:
      stabilizationWindowSeconds: 600
      policies:
      - type: Percent
        value: 50
        periodSeconds: 60
      - type: Pods
        value: 2
        periodSeconds: 60
      selectPolicy: Min
Multi-Cluster Federation
For enterprise environments spanning multiple clusters, implement federation for unified monitoring across your infrastructure.
Multi-Cluster Architecture
Object Storage)] RegionalCache[Regional Store
Gateways] end GlobalQuery --> USEReceive GlobalQuery --> USWReceive GlobalQuery --> RegionalCache USEThanos --> GlobalStorage USWThanos --> GlobalStorage USEThanosStg --> GlobalStorage USEReceive --> GlobalStorage USWReceive --> GlobalStorage RegionalCache --> GlobalStorage
External Cluster Configuration
Create values/thanos-external-cluster.yaml:
# Configuration for external cluster
query:
  enabled: true

  # Connect to local Prometheus and remote clusters
  stores:
  - dnssrv+_grpc._tcp.kube-prometheus-stack-thanos-discovery.monitoring.svc.cluster.local
  - thanos-query-frontend-grpc.us-east-1.company.com:443
  - thanos-query-frontend-grpc.eu-central-1.company.com:443

  # External labels for this cluster
  extraArgs:
  - --query.replica-label=prometheus_replica
  - --query.replica-label=__replica__
  - --label=cluster="us-west-2"
  - --label=region="us-west-2"

  # gRPC ingress for external access
  ingress:
    grpc:
      enabled: true
      hostname: thanos-query-grpc.us-west-2.company.com
      ingressClassName: nginx
      annotations:
        nginx.ingress.kubernetes.io/backend-protocol: "GRPC"
        nginx.ingress.kubernetes.io/grpc-backend: "true"
        cert-manager.io/cluster-issuer: "letsencrypt-prod"
      tls: true

# Store gateway for this region
storegateway:
  enabled: true

  # Regional store configuration
  extraArgs:
  - --selector.relabel-config-file=/etc/thanos/relabel.yml

  # Configure to serve only regional data
  configMaps:
  - name: store-relabel-config
    data:
      relabel.yml: |
        - source_labels: [cluster]
          regex: "us-west-2"
          action: keep
Global Query Configuration
Create values/thanos-global-query.yaml:
# Global Thanos Query for multi-cluster federation
query:
  enabled: true
  replicaCount: 5

  # All regional store endpoints
  stores:
  # Regional store gateways
  - thanos-store.us-east-1.company.com:10901
  - thanos-store.us-west-2.company.com:10901
  - thanos-store.eu-central-1.company.com:10901

  # Regional receive endpoints
  - thanos-receive.us-east-1.company.com:10901
  - thanos-receive.us-west-2.company.com:10901
  - thanos-receive.eu-central-1.company.com:10901

  # Direct Prometheus endpoints for real-time data
  - prometheus.us-east-1.company.com:10901
  - prometheus.us-west-2.company.com:10901
  - prometheus.eu-central-1.company.com:10901

  # Global query optimizations
  extraArgs:
  - --query.timeout=15m
  - --query.max-concurrent=100
  - --query.lookback-delta=15m
  - --query.auto-downsampling
  - --query.partial-response
  - --query.max-concurrent-select=16
  - --query.default-evaluation-interval=1m
  - --store.unhealthy-timeout=5m
  - --store.response-timeout=30s

  # Resource allocation for global scale
  resources:
    requests:
      cpu: 8000m
      memory: 16Gi
    limits:
      cpu: 16000m
      memory: 32Gi

queryFrontend:
  enabled: true

  # Global query frontend configuration
  extraArgs:
  - --query-range.split-interval=6h
  - --query-range.max-retries-per-request=5
  - --query-frontend.cache-compression-type=snappy
  - --query-frontend.downstream-tripper-config-file=/etc/thanos/tracing.yml

  # Global caching configuration
  config: |
    type: redis
    config:
      cluster_addrs:
      - redis-cluster-global.monitoring.svc.cluster.local:6379
      route_by_latency: true
      route_randomly: false
      expiration: 6h
Security and Compliance
Authentication and Authorization
RBAC Configuration
Create rbac/monitoring-rbac.yaml:
# Comprehensive RBAC for monitoring stack
apiVersion: v1
kind: ServiceAccount
metadata:
  name: prometheus-enterprise
  namespace: monitoring
---
apiVersion: rbac.authorization.k8s.io/v1
kind: ClusterRole
metadata:
  name: prometheus-enterprise
rules:
# Core Prometheus permissions
- apiGroups: [""]
  resources:
  - nodes
  - nodes/proxy
  - nodes/metrics
  - services
  - endpoints
  - pods
  - ingresses
  - configmaps
  verbs: ["get", "list", "watch"]
- apiGroups: ["extensions", "networking.k8s.io"]
  resources:
  - ingresses
  verbs: ["get", "list", "watch"]
- apiGroups: [""]
  resources:
  - configmaps
  verbs: ["get"]
- nonResourceURLs: ["/metrics", "/metrics/cadvisor"]
  verbs: ["get"]

# Monitoring CRDs
- apiGroups: ["monitoring.coreos.com"]
  resources:
  - servicemonitors
  - podmonitors
  - prometheusrules
  - probes
  verbs: ["get", "list", "watch"]
---
apiVersion: rbac.authorization.k8s.io/v1
kind: ClusterRoleBinding
metadata:
  name: prometheus-enterprise
roleRef:
  apiGroup: rbac.authorization.k8s.io
  kind: ClusterRole
  name: prometheus-enterprise
subjects:
- kind: ServiceAccount
  name: prometheus-enterprise
  namespace: monitoring
TLS and Encryption
TLS Configuration
Create tls/monitoring-tls.yaml:
# TLS certificate for monitoring components
apiVersion: cert-manager.io/v1
kind: Certificate
metadata:
  name: monitoring-tls
  namespace: monitoring
spec:
  secretName: monitoring-tls
  issuerRef:
    name: letsencrypt-prod
    kind: ClusterIssuer
  dnsNames:
  - prometheus.your-domain.com
  - thanos-query.your-domain.com
  - thanos.your-domain.com
  - alertmanager.your-domain.com
---
# TLS configuration for Thanos components
apiVersion: v1
kind: Secret
metadata:
  name: thanos-tls
  namespace: monitoring
type: kubernetes.io/tls
data:
  tls.crt: # Base64 encoded certificate
  tls.key: # Base64 encoded private key
  ca.crt:  # Base64 encoded CA certificate
Data Protection
Encryption at Rest
Update object storage configuration with encryption:
# Enhanced object storage configuration with encryption
type: s3
config:
  bucket: "enterprise-thanos-encrypted"
  endpoint: "s3.us-west-2.amazonaws.com"
  region: "us-west-2"
  access_key: "${AWS_ACCESS_KEY_ID}"
  secret_key: "${AWS_SECRET_ACCESS_KEY}"
  insecure: false
  signature_version2: false

  # Server-side encryption
  encrypt_sse: true
  sse_config:
    type: "SSE-KMS"
    kms_key_id: "arn:aws:kms:us-west-2:123456789012:key/12345678-1234-1234-1234-123456789012"

  # Additional security headers
  put_user_metadata:
    "X-Amz-Acl": "private"
    "data-classification": "internal"
    "encryption-required": "true"
Operational Excellence
Monitoring the Monitoring Stack
Self-Monitoring Configuration
Create monitoring/self-monitoring-rules.yaml:
Automated Operations
Backup and Recovery
Create backup/backup-job.yaml:
Disaster Recovery
Multi-Region DR Setup
Cross-Region Replication
Create dr/cross-region-config.yaml:
# Cross-region disaster recovery configuration
apiVersion: v1
kind: ConfigMap
metadata:
  name: disaster-recovery-config
  namespace: monitoring
data:
  dr-strategy.yml: |
    primary_region: us-west-2
    secondary_regions:
    - us-east-1
    - eu-central-1

    recovery_objectives:
      rpo: "15m"  # Recovery Point Objective
      rto: "30m"  # Recovery Time Objective

    backup_strategy:
      continuous_replication:
        enabled: true
        replication_lag_threshold: "5m"

      snapshots:
        frequency: "4h"
        retention: "30d"
        compression: true
        encryption: true

    failover_strategy:
      automated_triggers:
      - primary_region_down: "10m"
      - data_loss_detected: "immediate"

      manual_triggers:
      - security_incident
      - planned_maintenance
DR Testing
Create dr/dr-test-job.yaml:
Troubleshooting and Best Practices
Common Issues and Solutions
DNS Resolution Problems
Problem: Thanos Query cannot discover stores
Solution:
# Check DNS resolution
kubectl run -it --rm dns-test --image=nicolaka/netshoot --restart=Never -- dig _grpc._tcp.kube-prometheus-stack-thanos-discovery.monitoring.svc.cluster.local

# Verify service endpoints
kubectl get endpoints -n monitoring | grep thanos

# Check service labels
kubectl get service kube-prometheus-stack-thanos-discovery -n monitoring -o yaml
Object Storage Access Issues
Problem: Thanos components cannot access object storage
Diagnosis:
# Test object storage connectivity
kubectl exec -it thanos-query-0 -n monitoring -- thanos tools bucket ls --objstore.config-file=/etc/bucket/objstore.yml

# Check secret configuration
kubectl get secret thanos-objstore -n monitoring -o yaml

# Verify network policies
kubectl get networkpolicies -n monitoring
Performance Issues
Problem: Slow query performance
Optimization checklist:
- Enable query caching: Configure Redis cache for Query Frontend
- Optimize queries: Use recording rules for complex calculations
- Scale components: Increase replicas for Query and Store Gateway
- Tune resource allocation: Adjust CPU and memory limits
- Enable downsampling: Configure appropriate retention policies
Best Practices
Configuration Management
- Use Git for configuration: Store all Helm values and manifests in version control
- Environment-specific values: Separate values files for different environments
- Secret management: Use external secret management (Vault, External Secrets Operator)
- Configuration validation: Implement pre-commit hooks for YAML validation
Operational Practices
- Monitor the monitoring: Set up comprehensive self-monitoring
- Regular testing: Implement automated DR testing and backup verification
- Capacity planning: Regular review of resource usage and scaling needs
- Security updates: Keep components updated with latest security patches
- Documentation: Maintain runbooks and operational procedures
Scaling Guidelines
| Metric Volume | Prometheus Config | Thanos Config | Storage Strategy |
|---|---|---|---|
| < 1M series | Single instance | Basic setup | Local + 1y object |
| 1M-10M series | HA with 2 replicas | Multi-replica components | Fast local + 2y object |
| 10M-100M series | Sharded deployment | Horizontal scaling | NVMe + multi-region |
| > 100M series | Federation model | Full enterprise setup | Tiered storage strategy |
Upgrade Procedures
Safe Upgrade Process
- Backup current state:
# Backup configurations kubectl get all -n monitoring -o yaml > monitoring-backup-$(date +%Y%m%d).yaml # Backup PVCs kubectl get pvc -n monitoring -o yaml > pvc-backup-$(date +%Y%m%d).yaml -
Test in staging: Always test upgrades in a staging environment first
- Rolling upgrade strategy:
# Upgrade Prometheus Operator CRDs first helm upgrade prometheus-operator-crds prometheus-community/prometheus-operator-crds -n monitoring # Upgrade kube-prometheus-stack helm upgrade kube-prometheus-stack prometheus-community/kube-prometheus-stack -n monitoring -f values/kube-prometheus-stack.yaml # Upgrade Thanos helm upgrade thanos bitnami/thanos -n monitoring -f values/thanos.yaml - Verification after upgrade:
# Check pod status
kubectl get pods -n monitoring

# Verify metrics ingestion
kubectl port-forward svc/thanos-query 9090:9090 -n monitoring &
curl "http://localhost:9090/api/v1/query?query=up"
Conclusion
This comprehensive guide provides a complete roadmap for implementing enterprise-grade Prometheus and Thanos monitoring infrastructure. Starting with basic Helm installations and progressing through advanced enterprise configurations, you now have the knowledge and practical examples needed to build monitoring systems that can scale with your organization’s growth.
Key Implementation Steps Recap:
- Start with basics: Use the provided Helm configurations to establish core monitoring
- Implement security: Add RBAC, TLS, and network policies from day one
- Plan for scale: Design your architecture with growth in mind
- Automate operations: Implement backup, monitoring, and recovery procedures
- Test regularly: Validate your setup with automated testing and DR procedures
Enterprise Success Factors:
- Architectural Excellence: Multi-cluster federation and advanced scaling patterns
- Security First: Comprehensive security framework with encryption and access controls
- Operational Excellence: Self-monitoring, automated recovery, and disaster preparedness
- Performance Optimization: Advanced caching, resource management, and query optimization
- Continuous Improvement: Regular testing, monitoring, and refinement of your monitoring infrastructure
Whether you’re implementing monitoring for a single cluster or orchestrating observability across a global infrastructure, this guide provides the foundation for building monitoring systems that deliver reliable insights while maintaining the operational excellence required for enterprise success.

Comments