12 min to read
What is Prometheus and Thanos?
A comprehensive guide to Prometheus monitoring and Thanos scalability
Overview
Let’s explore Prometheus and Thanos, two powerful tools for monitoring and scaling metrics collection in cloud-native environments.
What is Prometheus?
Prometheus is an open-source monitoring and alerting system designed for reliability and scalability in dynamic cloud-native environments. It collects and stores time-series metrics with powerful querying capabilities, enabling real-time monitoring, trend analysis, and alerting for modern infrastructure and applications.
Introduction to Prometheus
Developed in 2012 at SoundCloud and now maintained by the Cloud Native Computing Foundation (CNCF), Prometheus has become the de facto standard for monitoring in Kubernetes environments.
Key design principles:
- Pull-based Architecture: Prometheus actively scrapes metrics from monitored targets
- Time Series Database: Optimized for storing metrics with timestamps
- Dimensional Data Model: Uses metric names and key-value pairs (labels) for efficient querying
- Resource Efficiency: Designed to operate with minimal overhead
- Operational Simplicity: Single binary deployment with no external dependencies
Prometheus is particularly well-suited for microservices architectures, containerized environments, and dynamic infrastructure where traditional monitoring solutions often struggle.
Core Components and Architecture
| Component | Description |
|---|---|
| Prometheus Server |
|
| Alertmanager |
|
| Pushgateway |
|
| Exporters |
|
| Client Libraries |
|
Key Features and Capabilities
- Multidimensional Data Model
- Time series identified by metric name and key-value pairs (labels)
- Enables flexible filtering, grouping, and aggregation
- Supports high-cardinality metrics with efficient storage
- PromQL (Prometheus Query Language)
- Powerful functional query language specifically designed for time series
- Supports complex mathematical operations and transformations
- Enables sophisticated aggregations and joins across metrics
- Built-in functions for rate calculations, histograms, and trend analysis
- Service Discovery Integration
- Native support for Kubernetes, Consul, AWS, Azure, GCP, and others
- Automatically adapts to changing infrastructure
- Supports both static and dynamic target configuration
- Alert Management
- Declarative alert definitions with PromQL expressions
- Multi-stage alert pipeline with deduplication and grouping
- Silencing and inhibition capabilities for alert management
What is Thanos?
Thanos is an open-source project that extends Prometheus capabilities by adding long-term storage, global query view, and high availability features. It enables a unified monitoring system that can scale across multiple clusters and regions while maintaining compatibility with the Prometheus ecosystem.
Introduction to Thanos
While Prometheus excels at monitoring individual environments, it faces several limitations in large-scale, distributed deployments:
- Limited Storage Capacity: Prometheus stores data locally, limiting retention periods
- High Availability Challenges: Single Prometheus instance represents a potential single point of failure
- Data Silos: Multiple Prometheus instances create isolated data that cannot be easily queried together
- Cross-Cluster Visibility: No built-in way to view metrics across multiple clusters
Thanos was designed to address these limitations while maintaining full compatibility with the Prometheus ecosystem, enabling organizations to scale their monitoring infrastructure without sacrificing functionality or requiring a complete architecture redesign.
Core Components and Architecture
| Component | Description |
|---|---|
| Sidecar |
|
| Querier |
|
| Store Gateway |
|
| Compactor |
|
| Ruler |
|
| Receiver |
|
Key Features and Benefits
Thanos Advantages
Global Query View
Seamless querying across multiple Prometheus instances Unified view regardless of geographic distribution Deduplication of replicated metrics Cross-cluster and cross-region visibility
Unlimited Storage Retention
- Integration with object storage (S3, GCS, Azure Blob, etc.)
- Configurable retention periods beyond Prometheus capabilities
- Cost-efficient long-term metrics storage
- Downsampling for optimal storage utilization
High Availability
- Redundant Prometheus deployments with deduplication
- No single point of failure in the architecture
- Resilience against instance and zone failures
- Continuous operation during upgrades and maintenance
Prometheus Compatibility
- Maintains compatibility with the Prometheus API
- Works with existing Prometheus deployments
- Compatible with Prometheus alerting and recording rules
- Supports PromQL without modifications<
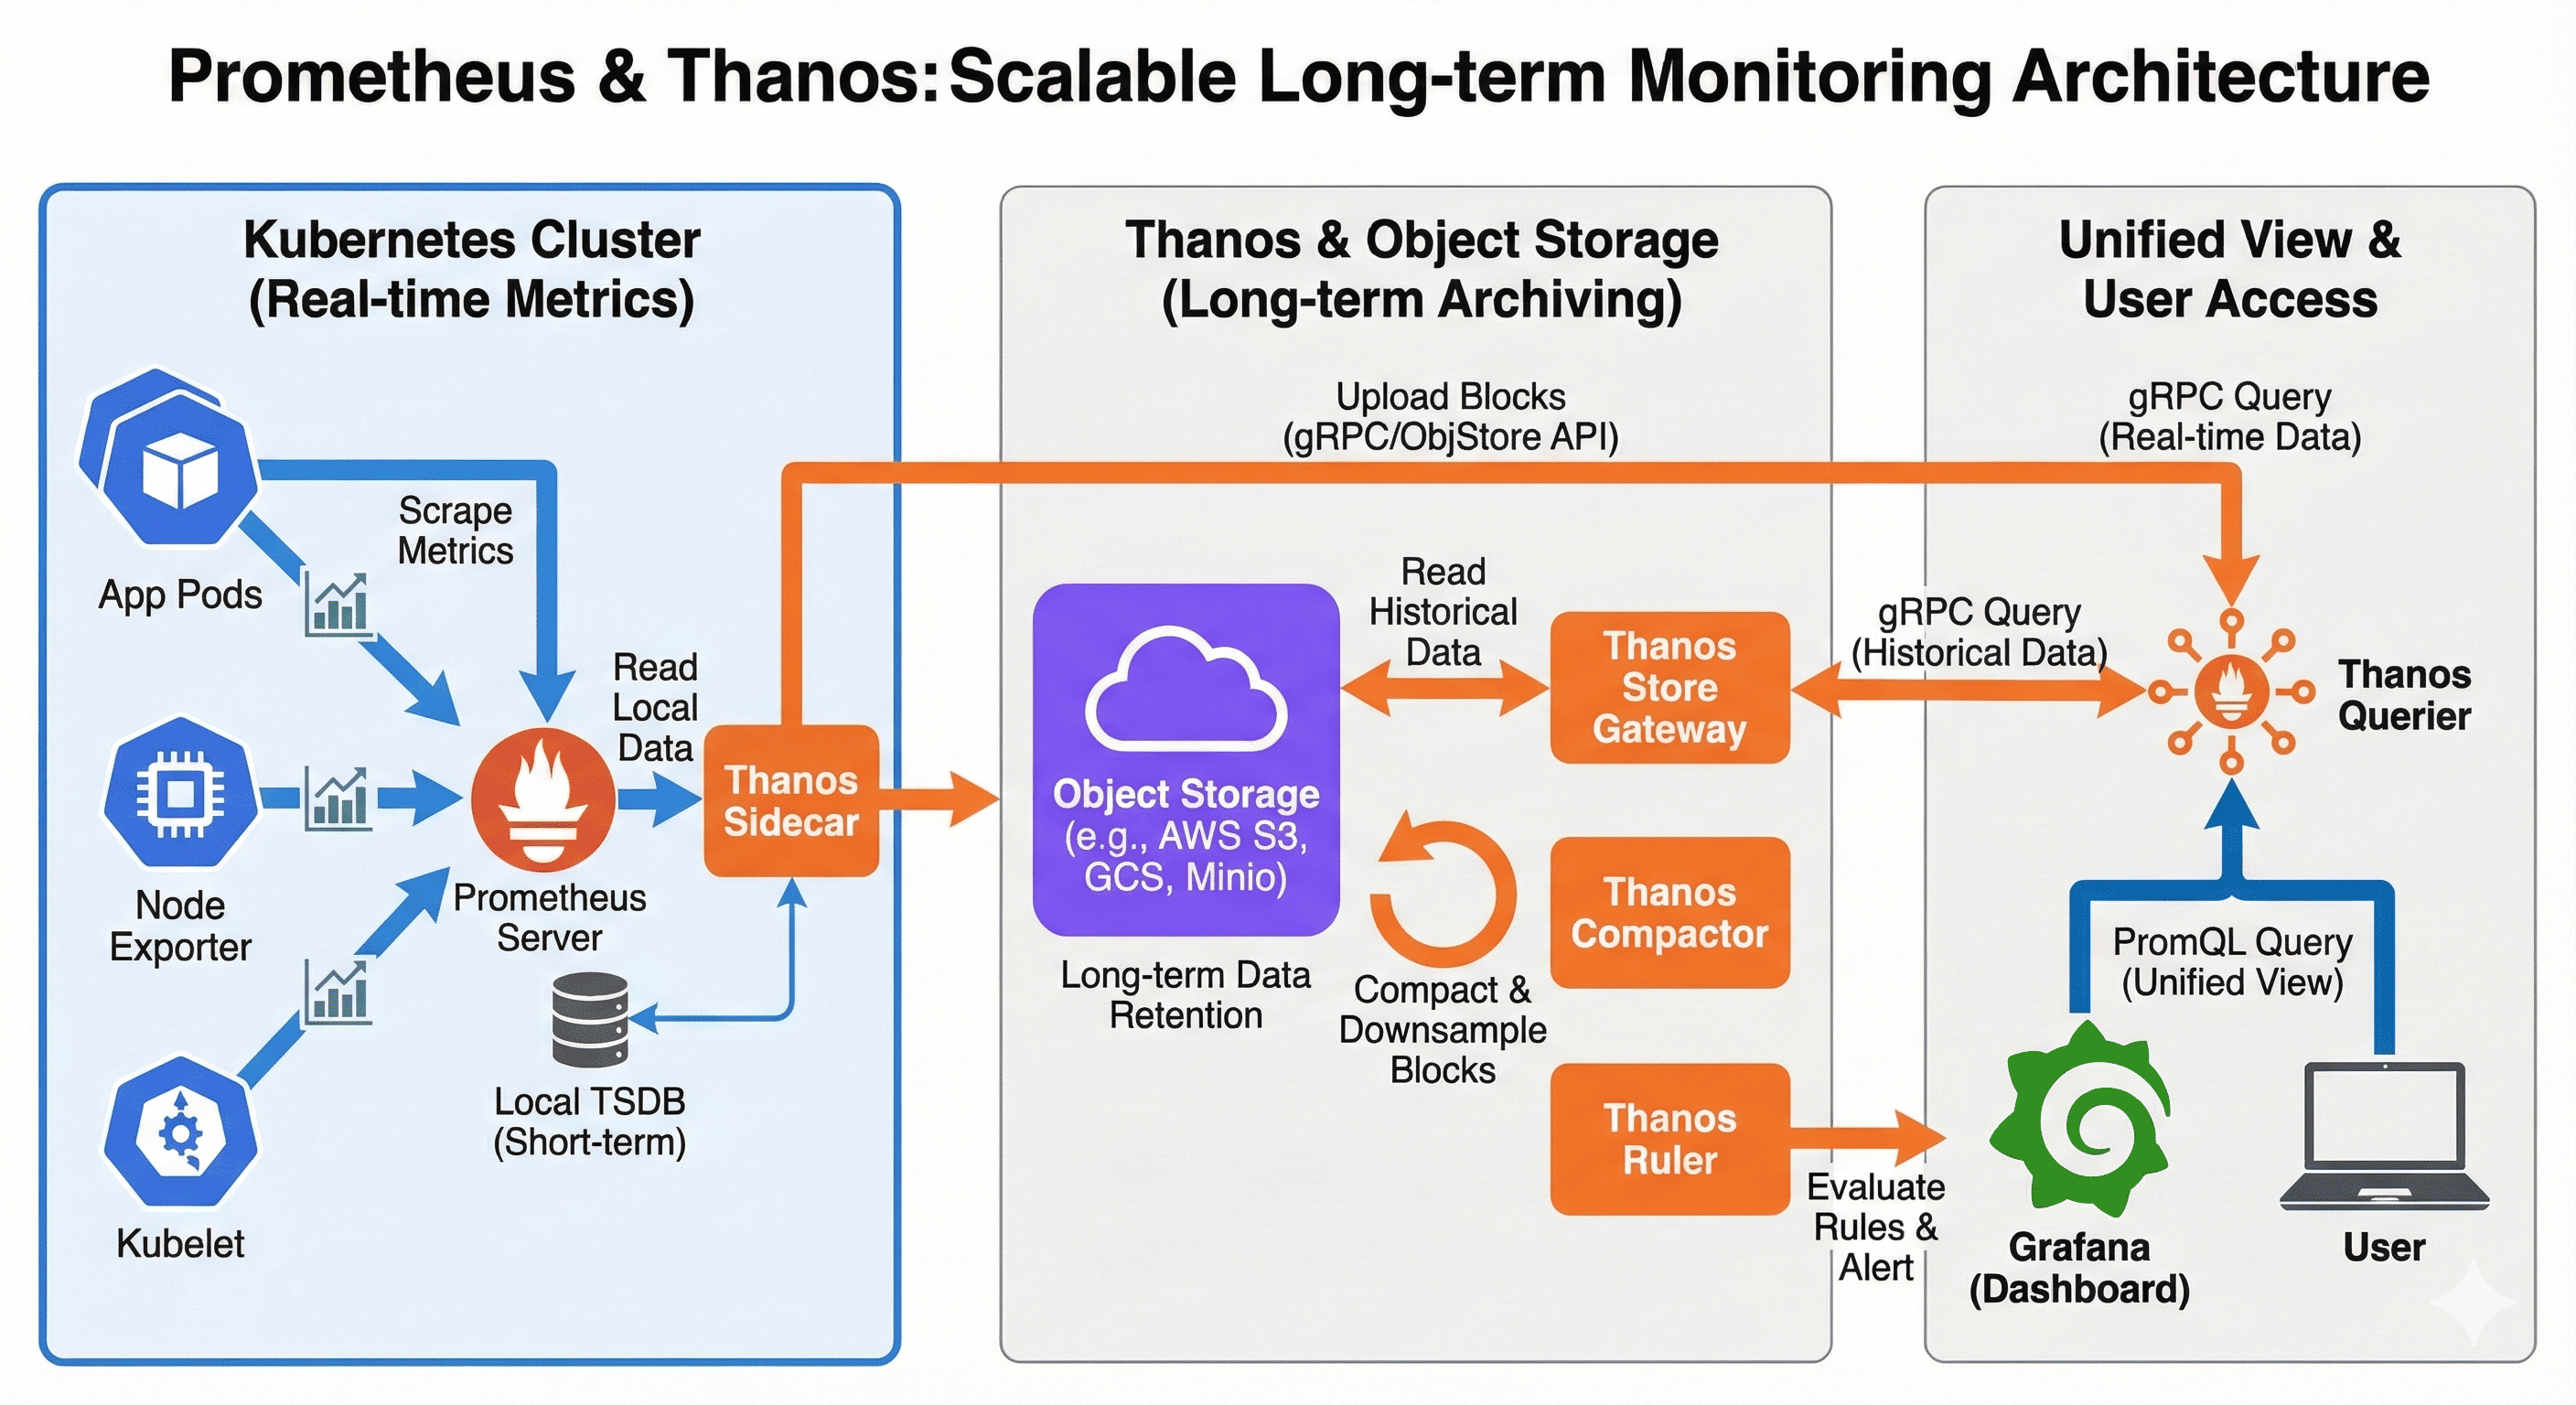
Data Flow in Prometheus and Thanos
Understanding the complete data flow from collection to visualization is essential for implementing and troubleshooting a Prometheus and Thanos deployment. This section details how metrics move through the system and how the various components interact to provide a scalable monitoring solution.
Metrics Collection and Storage Workflow
Component Interaction Details
- Metrics Collection
- Prometheus scrapes metrics from monitored targets at configured intervals
- Metrics are processed and stored in the local time series database (TSDB)
- Local storage is organized in 2-hour blocks (configurable)
- Data Uploading
- Thanos Sidecar monitors the Prometheus TSDB directory
- Completed blocks (typically 2 hours of data) are uploaded to object storage
- Blocks include both raw samples and metadata
- Original data remains in Prometheus local storage until its retention period expires
- Long-term Storage
- Object storage acts as the central repository for historical metrics
- Data is organized in a well-defined structure for efficient access
- Thanos Compactor periodically processes the stored blocks
- Compaction and downsampling reduce storage requirements while maintaining data utility
- Query Processing
- Thanos Query receives PromQL queries from users or visualization tools
- Determines which data sources (Prometheus instances, Store Gateways) to query
- Distributes the query to relevant sources in parallel
- Recent data comes directly from Prometheus instances via Sidecars
- Historical data is retrieved from object storage via Store Gateways
- Results are deduplicated, merged, and returned to the user
Data Flow Architecture in Prometheus and Thanos
Implementation Considerations
When implementing a Prometheus and Thanos monitoring solution, consider these critical factors:
Prometheus Deployment Strategies
Consider these architectural patterns for Prometheus deployments:
- Per-Service Monitoring: Dedicated Prometheus instances for critical services
- Per-Team Monitoring: Team-managed instances with relevant scrape targets
- Hierarchical Federation: Local instances with aggregation at higher levels
- Functional Sharding: Instances specialized by metric type or purpose
Key resource considerations:
- Memory Requirements: Approximately 1-2 bytes per sample in memory
- Storage Requirements: Around 1-2 bytes per sample on disk
- CPU Scaling: Increases with query complexity and scrape target count
- Retention Period: Local storage typically set to 15 days or less when using Thanos
Thanos Component Sizing
Resource Guidelines for Thanos Components:
Sidecar
- CPU: 1-2 cores depending on upload frequency
- Memory: 512MB-1GB base plus ~100MB per concurrent request
- Storage: Temporary space for block processing
Query
- CPU: 2-4 cores, scales with query volume
- Memory: 1-4GB base plus additional memory for concurrent queries
- Consider horizontal scaling for high-traffic deployments
Store Gateway
- CPU: 2 cores minimum, scales with query volume
- Memory: 2-8GB depending on index cache size and block count
- Scale horizontally for large object storage datasets
Compactor
- CPU: 1-2 cores, periodic usage pattern
- Memory: 8-16GB for large block processing
- Temporary storage: 3x the size of the largest block
Object Storage Considerations
Object Storage Planning:
Provider Selection
- S3: AWS S3, MinIO, Ceph Object Gateway
- GCS: Google Cloud Storage
- Azure: Azure Blob Storage
- Consider cost, performance, and geographic distribution
Data Growth Planning
- Raw metrics growth: ~1-2 bytes per sample
- Example: 1M active series at 15s scrape interval ≈ 2.5TB per year
- Downsampling can reduce storage by 10-100x for older data
Access Controls
- Use IAM roles with minimal necessary permissions
- Consider bucket policies to restrict access
- Enable encryption for sensitive metrics
Future Implementation Guide
In the upcoming post, we’ll provide a detailed implementation guide for Prometheus and Thanos in Kubernetes environments using Helm charts, covering configuration, deployment, and maintenance best practices.
Next Steps
Topics for the Implementation Guide:
Setting up Prometheus and Thanos using Helm Charts
- Detailed deployment configurations
- Resource requirements and scaling guidelines
- Security best practices
Configuring Multi-Cluster Metric Collection
- Cross-cluster communication setup
- Network considerations and security
- Unified service discovery
Implementing Unified Monitoring Across Clusters
- Global view configuration
- Cross-cluster alerting
- Grafana dashboard setup for unified visualization
Performance Tuning and Maintenance
- Query optimization techniques
- Resource management strategies
- Backup and disaster recovery planning
Key Points
-
Prometheus Core Features
- Pull-based metric collection with service discovery
- Powerful query language (PromQL) for flexible data analysis
- Integrated alerting and recording rules
- Designed for dynamic cloud-native environments -
Thanos Extensions
- Global query view across multiple Prometheus instances
- Unlimited metric retention with object storage integration
- High availability through redundant deployment
- Downsampling for efficient long-term storage -
Implementation Considerations
- Proper resource allocation for each component
- Strategic deployment across environments
- Object storage planning for long-term metrics
- Security and access control implementation

Comments