12 min to read
How to install Loki and Promtail with Helm
A guide to deploying Loki and Promtail on Kubernetes
Installing Loki and Promtail on Kubernetes
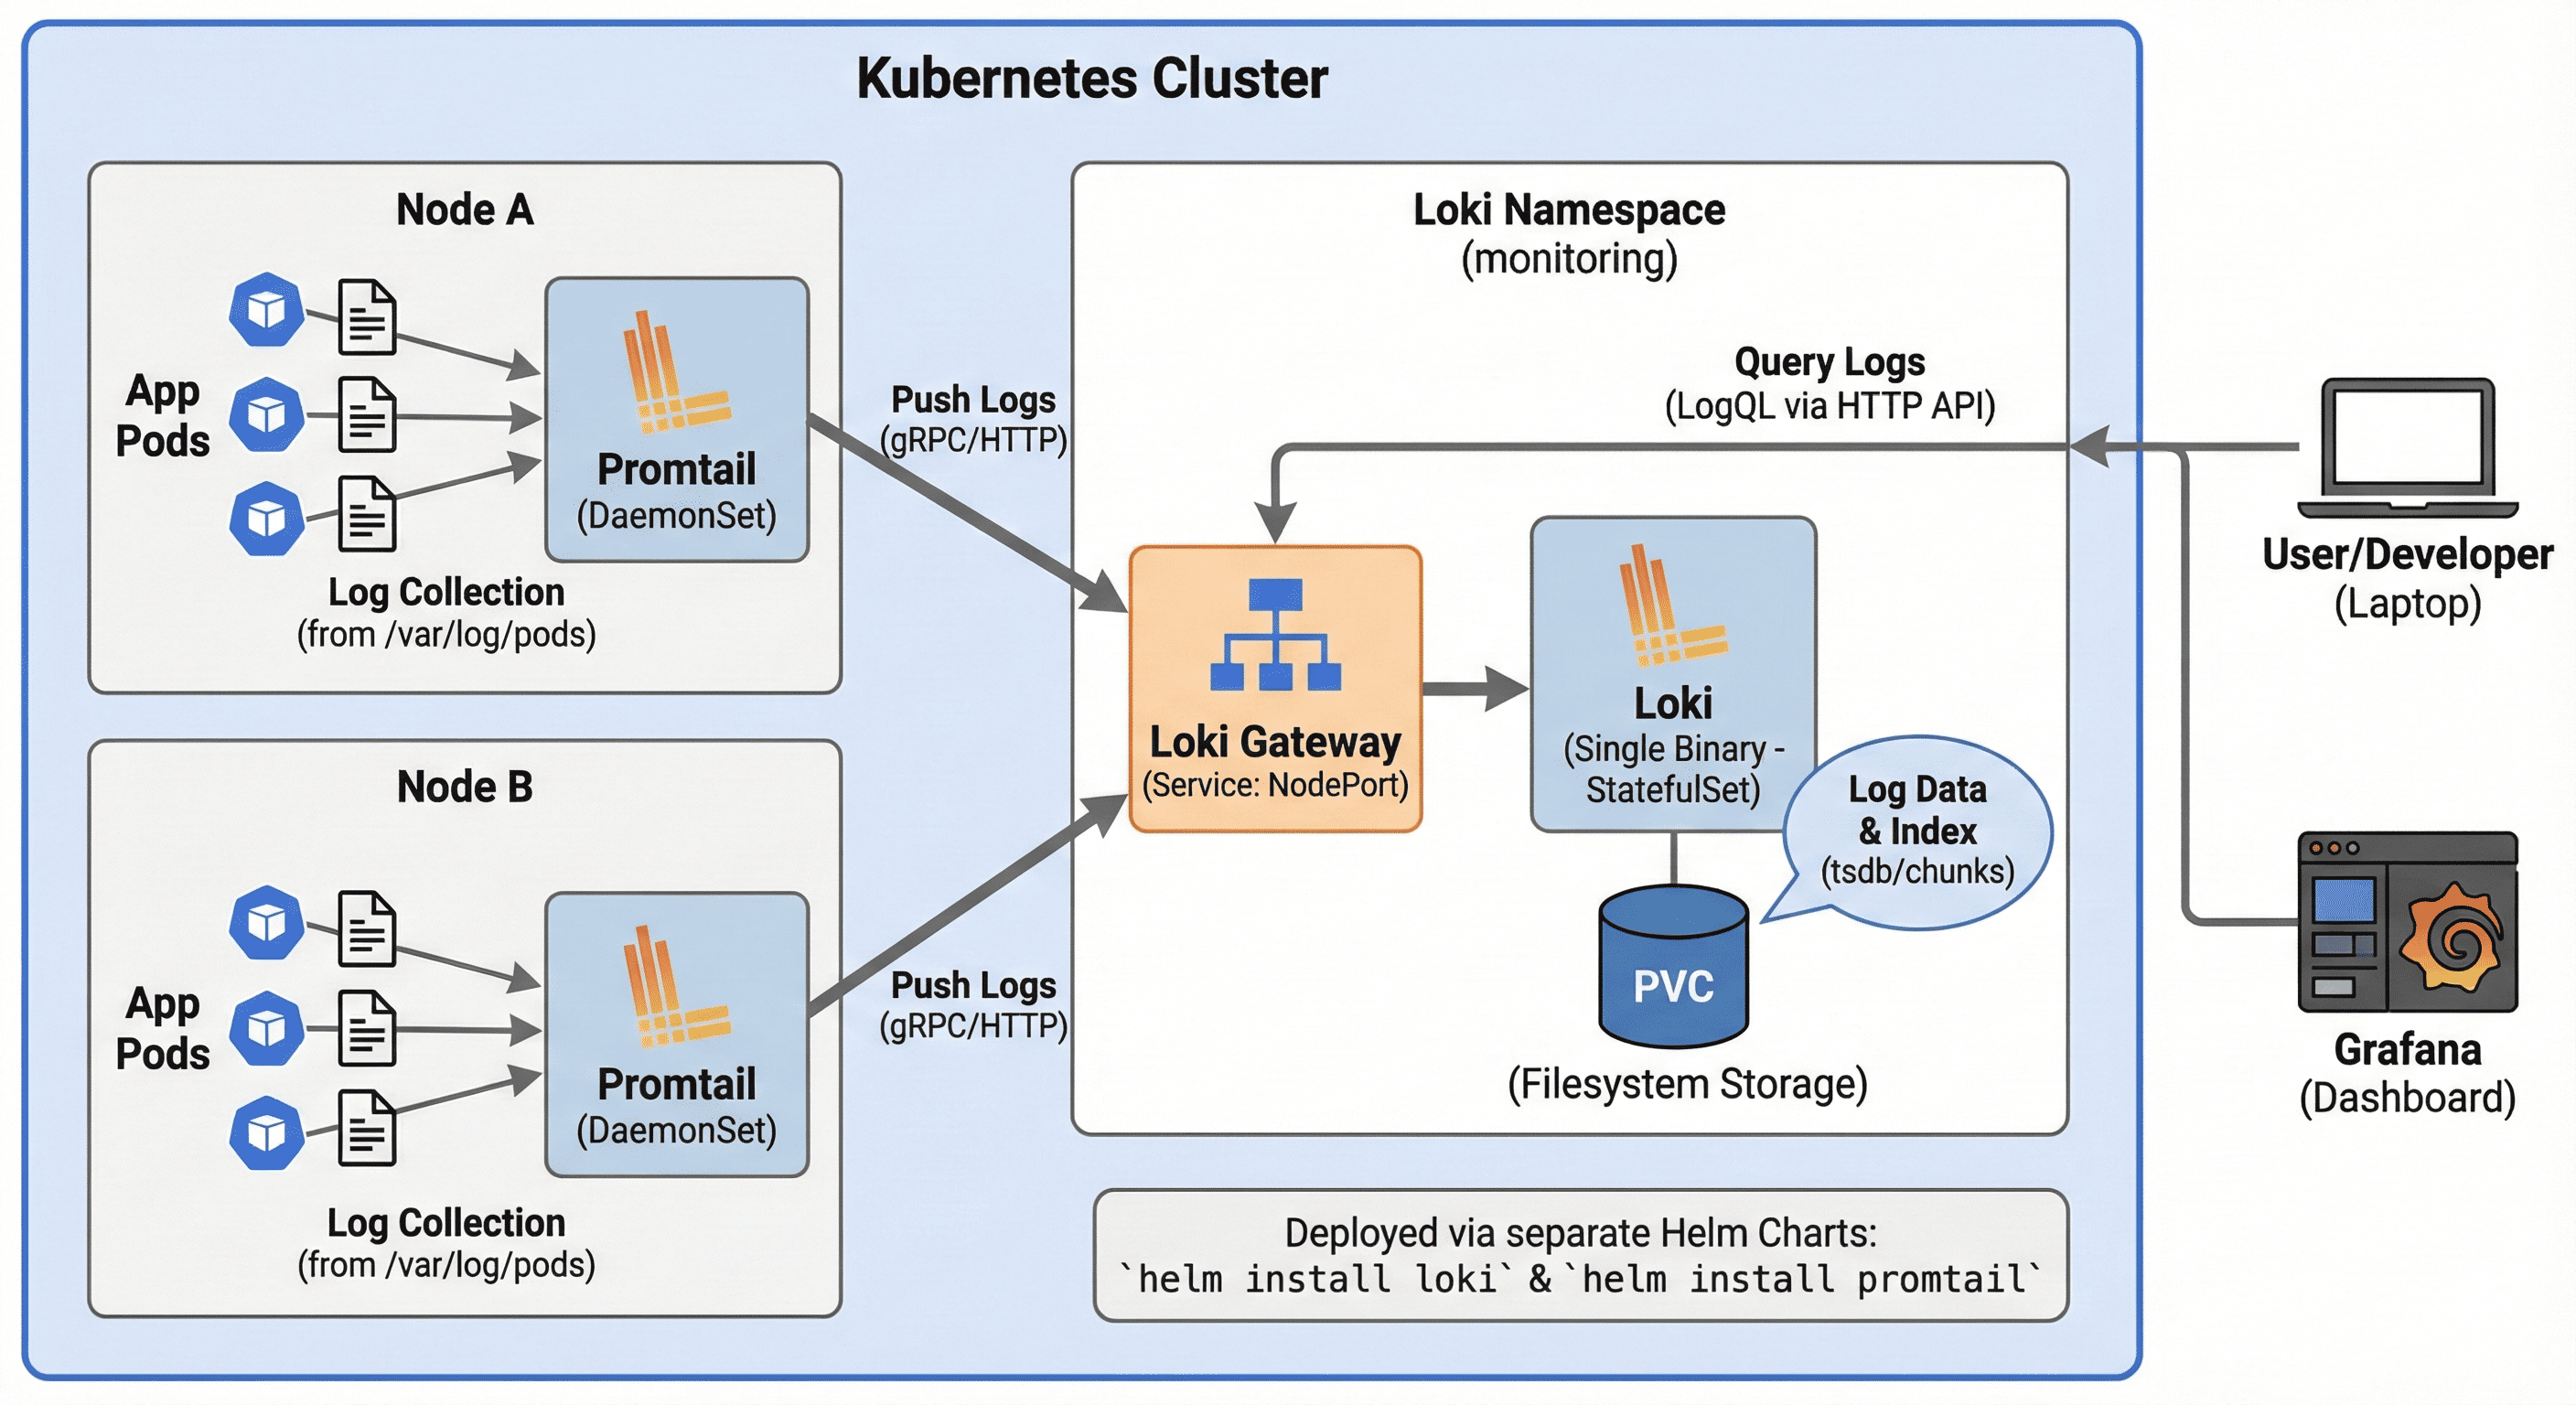
Loki and Promtail provide a powerful, resource-efficient logging stack for Kubernetes environments. This guide offers a step-by-step approach to installing and configuring both components using Helm charts, with a focus on optimizing for production use while minimizing resource consumption.
Introduction and Prerequisites
This guide follows our previous post about Loki architecture and components. Before proceeding with the installation, ensure you have the following prerequisites in place:
- Kubernetes Cluster: A running Kubernetes cluster with proper networking
- Storage: Storage provisioner configured for persistent volumes (default StorageClass)
- Helm: Helm 3.x installed and configured to work with your cluster
- kubectl: Properly configured with access to your cluster
- Namespace: A namespace for your monitoring stack (we'll use "monitoring" in this guide)
This guide uses a single-binary deployment mode for Loki, which is suitable for most small to medium deployments. For larger environments, you might want to consider the microservices deployment model.
Note:
We’re not using Loki-Stack due to version compatibility issues with recent Grafana query features. Instead, we’ll install Loki and Promtail separately using their dedicated Helm charts.
Loki Deployment Approaches
Loki can be deployed in different operational modes, each with its own advantages and resource requirements. This section explains the available deployment options and why we’ve chosen the single binary approach for this guide.
| Deployment Model | Best For | Characteristics |
|---|---|---|
| Single Binary |
Small to medium environments Testing and development Resource-constrained clusters |
|
| Microservices |
Large production environments High log volumes Multi-tenant deployments |
|
| Simple Scalable |
Medium production environments Growing environments Balance of simplicity and scale |
|
Installing Loki
We’ll deploy Loki in SingleBinary mode, which offers a good balance of simplicity and functionality for small to medium deployments. This approach bundles all Loki components into a single process, making it easier to manage while still providing all core capabilities.
Preparing for Installation
First, add the Grafana Helm repository and update your local Helm charts:
# Add the Grafana Helm repository
helm repo add grafana https://grafana.github.io/helm-charts

# Update Helm repositories
helm repo update
To access the latest charts and configurations, clone the Loki repository:
# Clone the Loki repository
git clone https://github.com/grafana/loki.git

# Navigate to the Helm chart directory
cd loki/production/helm/loki/

# Update chart dependencies
helm dependency update

# Create directory for custom values
mkdir values
cp values.yaml values/somaz.yaml
Loki Configuration
Configuration Parameters Explained
Here are the key parameters in our configuration:
- global.clusterDomain: Your Kubernetes cluster domain (default: cluster.local)
- deploymentMode: Mode of deployment (SingleBinary for this guide)
- loki.storage.type: Storage type for logs (filesystem for simplicity)
- persistence: Configuration for persistent volume claims
- gateway: Ingress settings for accessing Loki API
Custom Configuration File (values/somaz.yaml)
Create a custom values file with the following configuration:
global:
  clusterDomain: "somaz-cluster.local"
  dnsService: "coredns"
  dnsNamespace: "kube-system"
deploymentMode: SingleBinary
loki:
  commonConfig:
    replication_factor: 1
  storage:
    type: filesystem
  schemaConfig:
    configs:
    - from: "2024-01-01"
      store: tsdb
      index:
        prefix: loki_index_
        period: 24h
      object_store: filesystem
      schema: v13
singleBinary:
  replicas: 1
  persistence:
    enabled: true
    storageClass: "default"
    accessModes:
      - ReadWriteOnce
    size: 10Gi
gateway:
  enabled: true
  service:
    type: NodePort
    nodePort: 31400
# Disable unnecessary components for single binary mode
chunksCache:
  enabled: false
resultsCache:
  enabled: false
# ... (other components disabled)
Installation Process
Installing Loki with Helm
Now we’re ready to install Loki using our custom configuration:
# Verify configuration syntax
helm lint --values ./values/somaz.yaml

# Optional: Generate and review the installation manifest
helm install loki . -n monitoring -f ./values/somaz.yaml --create-namespace --dry-run >> output.yaml

# Install Loki
helm install loki . -n monitoring -f ./values/somaz.yaml --create-namespace

# If you need to upgrade later
helm upgrade loki . -n monitoring -f ./values/somaz.yaml
Verifying the Installation
Check Loki Components
Verify that all Loki components are running correctly:
Troubleshooting Tips
If you encounter issues with Loki deployment:
Check Pod Status
kubectl get pods -n monitoring
View Logs
kubectl logs -n monitoring deployment/loki
Verify PVCs
kubectl get pvc -n monitoring
Check Services
kubectl get svc -n monitoring
Common Issues
- Storage provisioning failures (check StorageClass)
- Insufficient resources (check resource limits/requests)
- Service connectivity issues (check services and endpoints)
Installing Promtail
Promtail is Loki’s log collection agent, designed to discover and forward logs from Kubernetes pods and containers. It runs as a DaemonSet, ensuring coverage across all nodes in your cluster and automatically labels logs with metadata from Kubernetes.
Preparing for Installation
Obtaining and Configuring the Promtail Chart
Clone the Grafana Helm charts repository to access the Promtail chart:
# Clone the Grafana Helm charts repository
git clone https://github.com/grafana/helm-charts.git

# Navigate to the Promtail chart directory
cd helm-charts/charts/promtail

# Update chart dependencies
helm dependency update

# Create directory for custom values
mkdir values
cp values.yaml values/somaz.yaml
Promtail Configuration
Key parameters in the Promtail configuration:
- daemonset.enabled: Deploys Promtail as a DaemonSet on all nodes
- serviceMonitor.enabled: Creates ServiceMonitor for Prometheus to scrape Promtail metrics
- config.logLevel: Log verbosity level (info, debug, etc.)
- config.serverPort: Port for Promtail's HTTP server
- config.clients: List of Loki instances to push logs to
The client URL points to the Loki Gateway service, which provides a centralized entry point to Loki.
Custom Configuration File (values/somaz.yaml)
Create a custom values file for Promtail with the following configuration:
daemonset:
  enabled: true
serviceMonitor:
  enabled: true
config:
  enabled: true
  logLevel: info
  logFormat: logfmt
  serverPort: 3101
  clients:
    - url: http://loki-gateway/loki/api/v1/push
Installation Process
Installing Promtail with Helm
Now we can install Promtail using our custom configuration:
# Verify configuration syntax
helm lint --values ./values/somaz.yaml

# Optional: Generate and review the installation manifest
helm install promtail . -n monitoring -f ./values/somaz.yaml --create-namespace --dry-run >> output.yaml

# Install Promtail
helm install promtail . -n monitoring -f ./values/somaz.yaml --create-namespace

# If you need to upgrade later
helm upgrade promtail . -n monitoring -f ./values/somaz.yaml
Advanced Promtail configurations you might consider for production:
- Resource Limits: Set appropriate CPU and memory limits
- Tolerations: Enable Promtail to run on tainted nodes
- extraVolumes: Mount additional log locations beyond standard paths
- extraScrapeConfigs: Add custom scrape configurations for non-standard log formats
- pipelineStages: Configure log processing pipelines to extract fields, add labels, etc.
Accessing and Using Your Logging Stack
With Loki and Promtail installed, you now have a powerful logging infrastructure for your Kubernetes cluster. This section covers how to access logs and integrate with other components of your monitoring stack.
Accessing Logs
Querying Logs Through Loki API
Loki provides a REST API for querying logs. You can access it directly:
Integrating with Grafana
Adding Loki as a Grafana Data Source
To visualize logs in Grafana:
- Open your Grafana instance
- Go to Configuration > Data Sources
- Click “Add data source” and select “Loki”
- Set the URL to
http://loki-gateway.monitoring.svc.cluster.local - Save and test the connection
Once connected, you can use Grafana’s Explore view to query logs and create dashboards that combine logs with metrics from Prometheus.
Sample LogQL Queries
Useful LogQL Queries for Kubernetes
Try these queries in Grafana’s Explore view to get started with Loki:
Next Steps
In our next post, we'll explore:
- Setting up Grafana: Install and configure Grafana for visualization
- Creating Dashboards: Build comprehensive dashboards combining metrics and logs
- Alert Configuration: Set up alerts based on log patterns and metrics
- Log Integration: Correlate logs with metrics from Prometheus and Thanos
- Advanced LogQL: Advanced query techniques for log analysis
Key Points
-
Deployment Approach
- Single Binary mode for Loki simplifies deployment
- DaemonSet deployment for Promtail ensures coverage on all nodes
- Persistent storage for Loki ensures log durability -
Configuration Highlights
- Filesystem storage used for simplicity (switch to object storage for production)
- NodePort service type enables external access
- ServiceMonitor integration for Prometheus metrics collection
- Simple client configuration for Promtail -
Usage Patterns
- Access logs via Loki API or Grafana
- Use LogQL for powerful querying capabilities
- Integrate with existing monitoring infrastructure
- Consider multi-tenancy for team isolation in larger environments

Comments