12 min to read
What is Loki?
A comprehensive guide to Grafana Loki and its components
What is Loki?
Grafana Loki is a horizontally-scalable, highly-available log aggregation system designed specifically for cloud-native environments. Unlike traditional logging solutions, Loki indexes metadata rather than log content, resulting in a cost-effective, efficient logging platform that integrates seamlessly with Prometheus and Grafana.
Introduction to Loki
The Log Aggregation Challenge
Modern cloud-native environments generate vast amounts of log data that need to be collected, stored, and analyzed efficiently. Traditional logging solutions often become prohibitively expensive at scale due to their approach of indexing the entire log content.
Grafana Labs developed Loki to address these challenges by taking a different approach:
- Label-Based Indexing: Indexes metadata (labels) instead of log content
- Prometheus-Inspired: Uses the same label selector approach as Prometheus
- Cloud-Native Design: Built for containerized environments from the ground up
- Resource Efficient: Significantly lower resource requirements compared to traditional solutions
- Cost-Effective: Designed to keep operational costs manageable even at scale
This innovative approach allows organizations to collect and retain more logs for longer periods without exponential cost increases.
Key Features and Benefits
| Feature | Description |
|---|---|
| Label-Based Indexing |
|
| LogQL |
|
| Multi-Tenancy |
|
| Storage Flexibility |
|
| Integration Ecosystem |
|
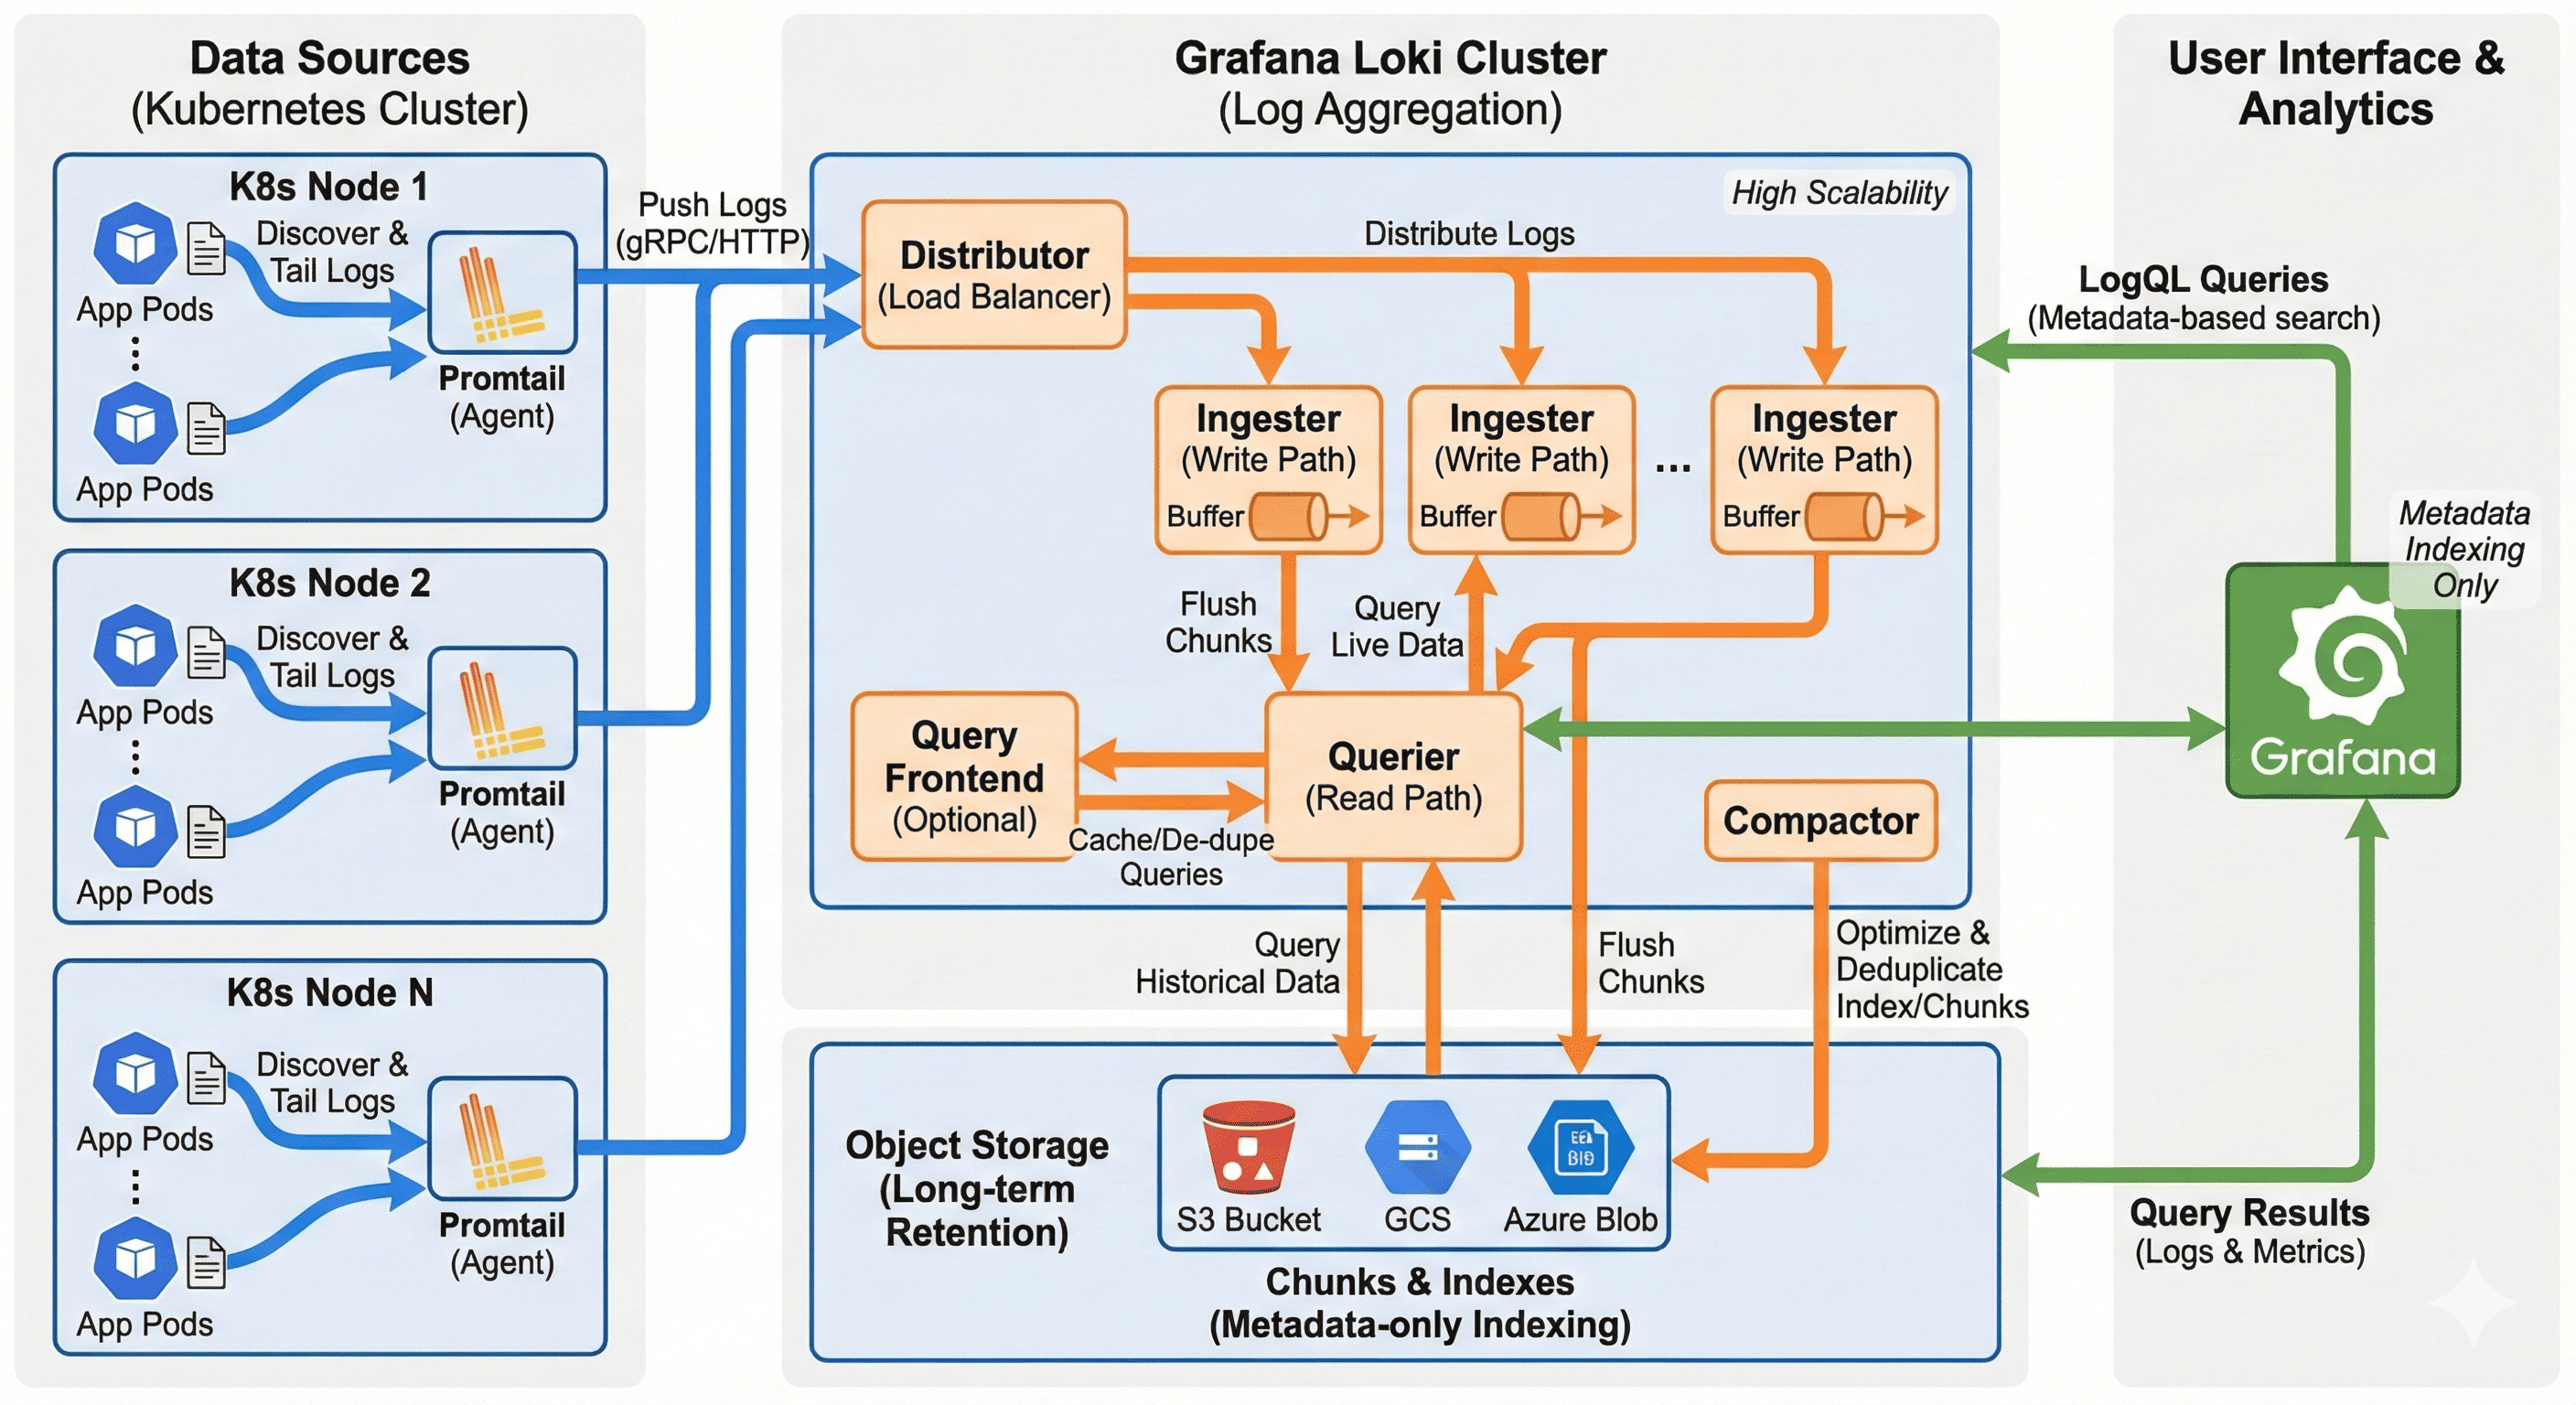
Loki Architecture
Loki’s architecture is designed for horizontal scalability and high availability, with components that can be deployed either as a monolith for simplicity or as separate microservices for production environments. This section explores the architecture and interactions between Loki’s components.
Deployment Models
Deployment Options
Loki offers flexible deployment models to accommodate different requirements:
Monolithic Mode
- Single binary containing all components
- Ideal for small to medium deployments
- Simpler to deploy and manage
- Lower operational overhead
Microservices Mode
- Components deployed as separate services
- Higher scalability and resilience
- Independent scaling of components based on workload
- Recommended for production and large-scale deployments
Simple Scalable Mode
- A middle ground between monolithic and microservices
- Groups compatible components together
- Reduces operational complexity while providing scalability
Core Components
| Component | Description |
|---|---|
| Distributor |
|
| Ingester |
|
| Querier |
|
| Query Frontend |
|
| Compactor |
|
Storage Architecture
Loki’s Storage Layers
Loki separates storage concerns into distinct components:
Index Store
- Contains mappings of labels to log chunks
- Optimized for fast lookups during queries
- Typically stored in a database (BoltDB, Cassandra, BigTable, etc.)
Chunk Store
- Stores the actual compressed log data
- Optimized for space efficiency
- Typically stored in object storage (S3, GCS, Azure Blob, etc.)
- Uses content-addressable storage for deduplication
Write-Ahead Log (WAL)
- Ensures data durability during ingester failures
- Temporary storage before data is committed to long-term storage
- Allows ingesters to recover their state after restarts
Promtail: Loki’s Log Collection Agent
Promtail is Loki’s purpose-built log collection agent, designed to discover, process, and ship logs to Loki with minimal overhead. It extracts relevant metadata from logs and attaches them as labels, enabling Loki’s efficient index-based log retrieval.
How Promtail Works
Promtail Workflow
Promtail’s operation follows a systematic process:
Log Discovery
- Scans file system for logs based on configured path patterns
- Uses inotify (Linux) or similar mechanisms to detect file changes
- Tracks file positions to ensure logs are read only once
- In Kubernetes, discovers pods and their log locations automatically
Metadata Extraction
- Extracts context information from file paths and names
- In Kubernetes, queries the API server for pod metadata
- Adds labels like namespace, pod_name, container_name, and application
- Applies custom relabeling rules to modify or add labels
Processing Pipeline
- Applies optional transformations to log content
- Parses structured logs (JSON, logfmt) into labels
- Extracts additional labels from log content using regex patterns
- Filters logs based on configured criteria
Batching and Shipping
- Groups logs by stream (unique label set)
- Batches logs for efficient transmission
- Compresses batches to reduce network bandwidth
- Ships logs to Loki’s distributor component
Reliability Mechanisms
- Implements backoff and retry logic for network issues
- Maintains buffer in case of Loki unavailability
- Updates position file after successful transmission
- Handles log rotation and file truncation
Promtail Configuration
Key Configuration Areas
Promtail’s behavior is controlled through several configuration sections:
# Basic Promtail configuration example
server:
  http_listen_port: 9080

positions:
  filename: /run/promtail/positions.yaml

clients:
  - url: http://loki:3100/loki/api/v1/push

scrape_configs:
  - job_name: kubernetes-pods
    kubernetes_sd_configs:
      - role: pod
    relabel_configs:
      - source_labels: [__meta_kubernetes_pod_label_app]
        target_label: app
      - source_labels: [__meta_kubernetes_pod_container_name]
        target_label: container
      - source_labels: [__meta_kubernetes_namespace]
        target_label: namespace
      - source_labels: [__meta_kubernetes_pod_name]
        target_label: pod
Advanced Configuration Options
Promtail provides advanced options for complex log processing needs:
Pipeline Stages
A series of transformations applied to logs:
- json: Parse JSON logs and extract fields as labels
- regex: Extract fields using regular expressions
- timestamp: Parse and normalize log timestamps
- template: Create new labels or values using Go templates
- match: Conditionally apply stages based on log content
- drop: Filter out logs that match certain criteria
Kubernetes Integration
- Automatic service discovery for pods and their logs
- Label extraction from pod metadata, annotations, and labels
- Filtering based on namespaces or pod labels
Multi-tenancy Support
- Configure tenant ID for logs sent to Loki
- Support different tenants based on log source
LogQL: Loki’s Query Language
LogQL is Loki’s query language, designed to be familiar to PromQL users while providing powerful capabilities for log filtering, processing, and metric extraction. It combines the simplicity of label selectors with the power of log content filtering and aggregation.
Basic Query Structure
LogQL Query Components
LogQL queries typically consist of two parts:
- Log Stream Selector: Uses label matchers to select the log streams
- Log Pipeline: Optional set of operations to filter, parse, or transform the selected logs
{app="frontend", namespace="production"} |= "error" | json | line_format "{message}"
| Query Type | Examples |
|---|---|
| Basic Label Selection |
{app="frontend"} - Select logs with app label "frontend"{namespace="production", container="api"} - Select logs from the "api" container in "production" namespace
|
| Text Filtering |
{app="frontend"} |= "error" - Logs containing "error"{app="frontend"} |~ "error|warning" - Logs matching regex "error|warning"{app="frontend"} != "debug" - Logs not containing "debug"
|
| Structured Log Parsing |
{app="frontend"} | json - Parse logs as JSON{app="frontend"} | logfmt - Parse logs in logfmt format{app="frontend"} | pattern - Extract fields using pattern
|
| Metric Queries |
rate({app="frontend"} |= "error" [5m]) - Error rate per second over 5 minutescount_over_time({app="frontend"} [1h]) - Log count over 1 hoursum by (container) (rate({namespace="production"} |= "error" [5m])) - Error rate aggregated by container
|
Using Loki in Kubernetes
Loki is particularly well-suited for Kubernetes environments, providing efficient log collection and analysis with minimal resource overhead. This section covers practical aspects of deploying and using Loki in Kubernetes clusters.
Deployment Recommendations
Kubernetes Deployment Best Practices
For effective Loki deployment in Kubernetes:
Resource Planning
- Ingesters require the most memory (start with 2-4GB per replica)
- Scale the number of distributor replicas based on log volume
- Start with 3 replicas of each component for high availability
Storage Configuration
- Use object storage (S3, GCS) for chunks in production environments
- Use a database (Cassandra, DynamoDB) or clustered file system for index
- Configure appropriate retention periods based on compliance needs
Promtail Setup
- Deploy as a DaemonSet to ensure coverage on all nodes
- Mount
/var/logand/var/lib/docker/containersfor complete log access - Configure service account with permissions to query the Kubernetes API
Security Considerations
- Use network policies to restrict communication between components
- Configure authentication for Loki API access
- Implement multi-tenancy if multiple teams share the cluster
Installation with Helm
Using Helm for Deployment
Helm provides a convenient way to deploy Loki and Promtail:
Integration with Existing Monitoring Stack
To integrate Loki with an existing Prometheus and Grafana setup:
- Deploy only Loki and Promtail components
- Configure Grafana data source for Loki
- Use Explore view in Grafana to query logs
- Create dashboards combining metrics and logs
Key Points
Loki Summary
Architecture Approach
- Label-based indexing instead of full-text indexing
- Significantly more efficient resource utilization
- Horizontal scalability with microservices architecture
- Seamless integration with Prometheus and Grafana
Core Components
- Promtail: Efficient log collection agent
- Distributor: Log ingestion and validation
- Ingester: Log buffering and storage
- Querier: Log retrieval and processing
- Query Frontend: Query optimization and caching
Practical Benefits
- Cost-effective logging at scale
- Familiar query language for Prometheus users
- Native Kubernetes integration
- Unified observability with metrics and logs
- Simple deployment and maintenance

Comments