10 min to read
ELK Stack Implementation Guide
Learn how to implement ELK Stack (Elasticsearch, Logstash, Kibana) for log management and analysis.
What is ELK Stack?
The ELK Stack is a powerful log management and analytics solution that combines three open-source tools: Elasticsearch for search and analytics, Logstash for data processing, and Kibana for visualization. Together, they provide a comprehensive platform for collecting, processing, storing, and visualizing data from diverse sources, enabling efficient monitoring, troubleshooting, and insights extraction.
Overview of Components
The ELK Stack consists of three primary components, each serving a distinct purpose in the log management pipeline:
- Elasticsearch: A distributed, RESTful search and analytics engine capable of storing and searching vast volumes of data quickly
- Logstash: A server-side data processing pipeline that ingests data from multiple sources, transforms it, and sends it to Elasticsearch
- Kibana: A visualization layer that provides charts, graphs, and dashboards for exploring, visualizing, and analyzing data stored in Elasticsearch
Additional components often used with the ELK Stack:
- Beats: Lightweight data shippers that send data from edge machines to Logstash or Elasticsearch
- Filebeat: Specifically designed for forwarding and centralizing log data
- Metricbeat: Collects metrics from system and services
The term "Elastic Stack" is now often used to refer to the expanded ecosystem that includes Beats and other extensions.
Architecture
Log Pipeline
Metric Pipeline
APM Pipeline
EFK Stack Log Pipeline
The EFK Stack replaces Logstash with Fluentd for a lighter, more resource-efficient implementation:
Key Components in Detail
Elasticsearch
| Aspect | Description |
|---|---|
| Purpose | Distributed search and analytics engine for storing, searching, and analyzing large volumes of data |
| Architecture | RESTful, distributed, horizontally scalable with support for clustering |
| Data Storage | Document-oriented database that stores complex data structures as JSON documents |
| Indexing | Uses inverted indices for fast full-text search capabilities |
| Scalability | Scales horizontally by adding more nodes to the cluster |
| Key Features |
- Near real-time search - Distributed architecture for high availability - Multi-tenancy capabilities - Full-text search with powerful query DSL - Aggregations for data analysis |
Logstash
| Aspect | Description |
|---|---|
| Purpose | Data collection and processing pipeline that ingests data from multiple sources, transforms it, and sends it to Elasticsearch |
| Architecture | Three-stage pipeline: inputs → filters → outputs |
| Inputs | Supports various input sources: logs, metrics, web applications, data stores, and AWS services |
| Filters | Powerful processing capabilities for parsing, transforming, and enriching data |
| Outputs | Can route data to multiple destinations, including Elasticsearch, files, and external services |
| Key Features |
- Extensive plugin ecosystem - Grok pattern matching for unstructured data parsing - Data enrichment capabilities - Conditional processing logic - Buffer management for handling load spikes |
Kibana
| Aspect | Description |
|---|---|
| Purpose | Data visualization and exploration tool for Elasticsearch data |
| Architecture | Browser-based interface that communicates directly with Elasticsearch |
| Visualizations | Wide range of visualization types: charts, graphs, tables, maps, and more |
| Dashboards | Combines multiple visualizations into comprehensive dashboards |
| Search | Powerful search interface for exploring and filtering data in Elasticsearch |
| Key Features |
- Discover interface for log exploration - Dashboard creation and sharing - Canvas for creating custom presentations - Machine Learning capabilities - Lens for drag-and-drop visualizations |
Filebeat
| Aspect | Description |
|---|---|
| Purpose | Lightweight log shipper for forwarding and centralizing log data |
| Architecture | Agent-based, installed on servers to collect and forward log files |
| Resource Usage | Minimal CPU and memory footprint compared to Logstash |
| Reliability | Guarantees at-least-once delivery with internal queuing and backpressure handling |
| Key Features |
- Handles log rotation and truncation - Maintains file state to resume after restarts - Supports various input types and formats - Built-in modules for common log formats - Can send directly to Elasticsearch or via Logstash |
Implementation Guide
This section provides a step-by-step guide for implementing the ELK Stack in a Kubernetes environment using Helm charts, with configurations optimized for efficient log collection and analysis.
Installation Methods
The ELK Stack can be deployed in Kubernetes using either of these methods:
1️⃣ Using Archived Helm Charts
- Uses the Elastic Helm Charts repository that was archived on May 16, 2023
- Simpler to configure for basic use cases
- Ideal for internal development servers or testing environments
- Reference repository: https://github.com/elastic/helm-charts
- Implementation reference: https://github.com/somaz94/helm-chart-template/tree/main/k8s-service/monitoring/elk-stack
2️⃣ Using Latest Version (ECK Operator)
- Uses the Elastic Cloud on Kubernetes (ECK) operator
- More powerful and feature-rich
- Better for production environments
- Supports newer Elastic Stack features
- Implementation guides:
Installation Order
For proper dependency management, install components in this sequence:
- Elasticsearch - The core data store that must be available first
- Kibana - Requires Elasticsearch to be running
- Logstash - Needs to connect to Elasticsearch
- Filebeat - Can ship logs to either Logstash or Elasticsearch
Configuration Examples
Here are key configuration examples for the ELK Stack components:
Filebeat Configuration
filebeatConfig:
  filebeat.yml: |
    filebeat.inputs:
    - type: log
      paths:
        - /usr/share/filebeat/app/somaz/dev/app/logs/*  # Mounted log path
        - /usr/share/filebeat/app/somaz/dev/app/logs/**/*
      fields:
        log_source: "dev-somaz-app"  # This becomes Elasticsearch index name
        environment: "dev"
        app: "somaz"
        component: "app"
      fields_under_root: true
      json.keys_under_root: true      # Promote JSON fields to root level
      json.add_error_key: true        # Add error field on JSON parsing failure
      json.expand_keys: true          # Expand nested JSON strings
      processors:
        - decode_json_fields:
            fields: ["data"]
            process_array: true
            max_depth: 2
            target: ""
            overwrite_keys: true
        - script:
            lang: javascript
            source: |
              function process(event) {
                // JSON processing logic
                return event;
              }
Logstash Configuration
logstashPipeline:
  logstash.conf: |
    input {
      beats {
        port => 5044
      }
    }

    filter {
      if [log_source] {
        mutate {
          add_field => { "index_name" => "%{log_source}" }
        }
      }
      # Additional processing configurations...
    }

    output {
      elasticsearch {
        hosts => ["https://elasticsearch-master:9200"]
        user => "${ELASTICSEARCH_USERNAME}"
        password => "${ELASTICSEARCH_PASSWORD}"
        ssl_certificate_verification => true
        cacert => '/usr/share/logstash/config/certs/ca.crt'
        index => "%{index_name}"
      }
    }
Verification Process
After setting up the ELK Stack, verify the installation with these steps:
Check Elasticsearch Indices
# Check Elasticsearch indices
curl -k -u "elastic:password" "http://elasticsearch.somaz.link/_cat/indices?v"

# Sample output:
health status index                          uuid                   pri rep docs.count docs.deleted store.size pri.store.size
yellow open   .kibana-event-log-8.5.1-000002 0YwfADLHQryK5bYlBpBm5Q   1   1          0            0       225b           225b
yellow open   dev-somaz-app                  9zip7n0sdfasdfsadfsdfsdaf 1   1      24161            0      6.5mb          6.5mb
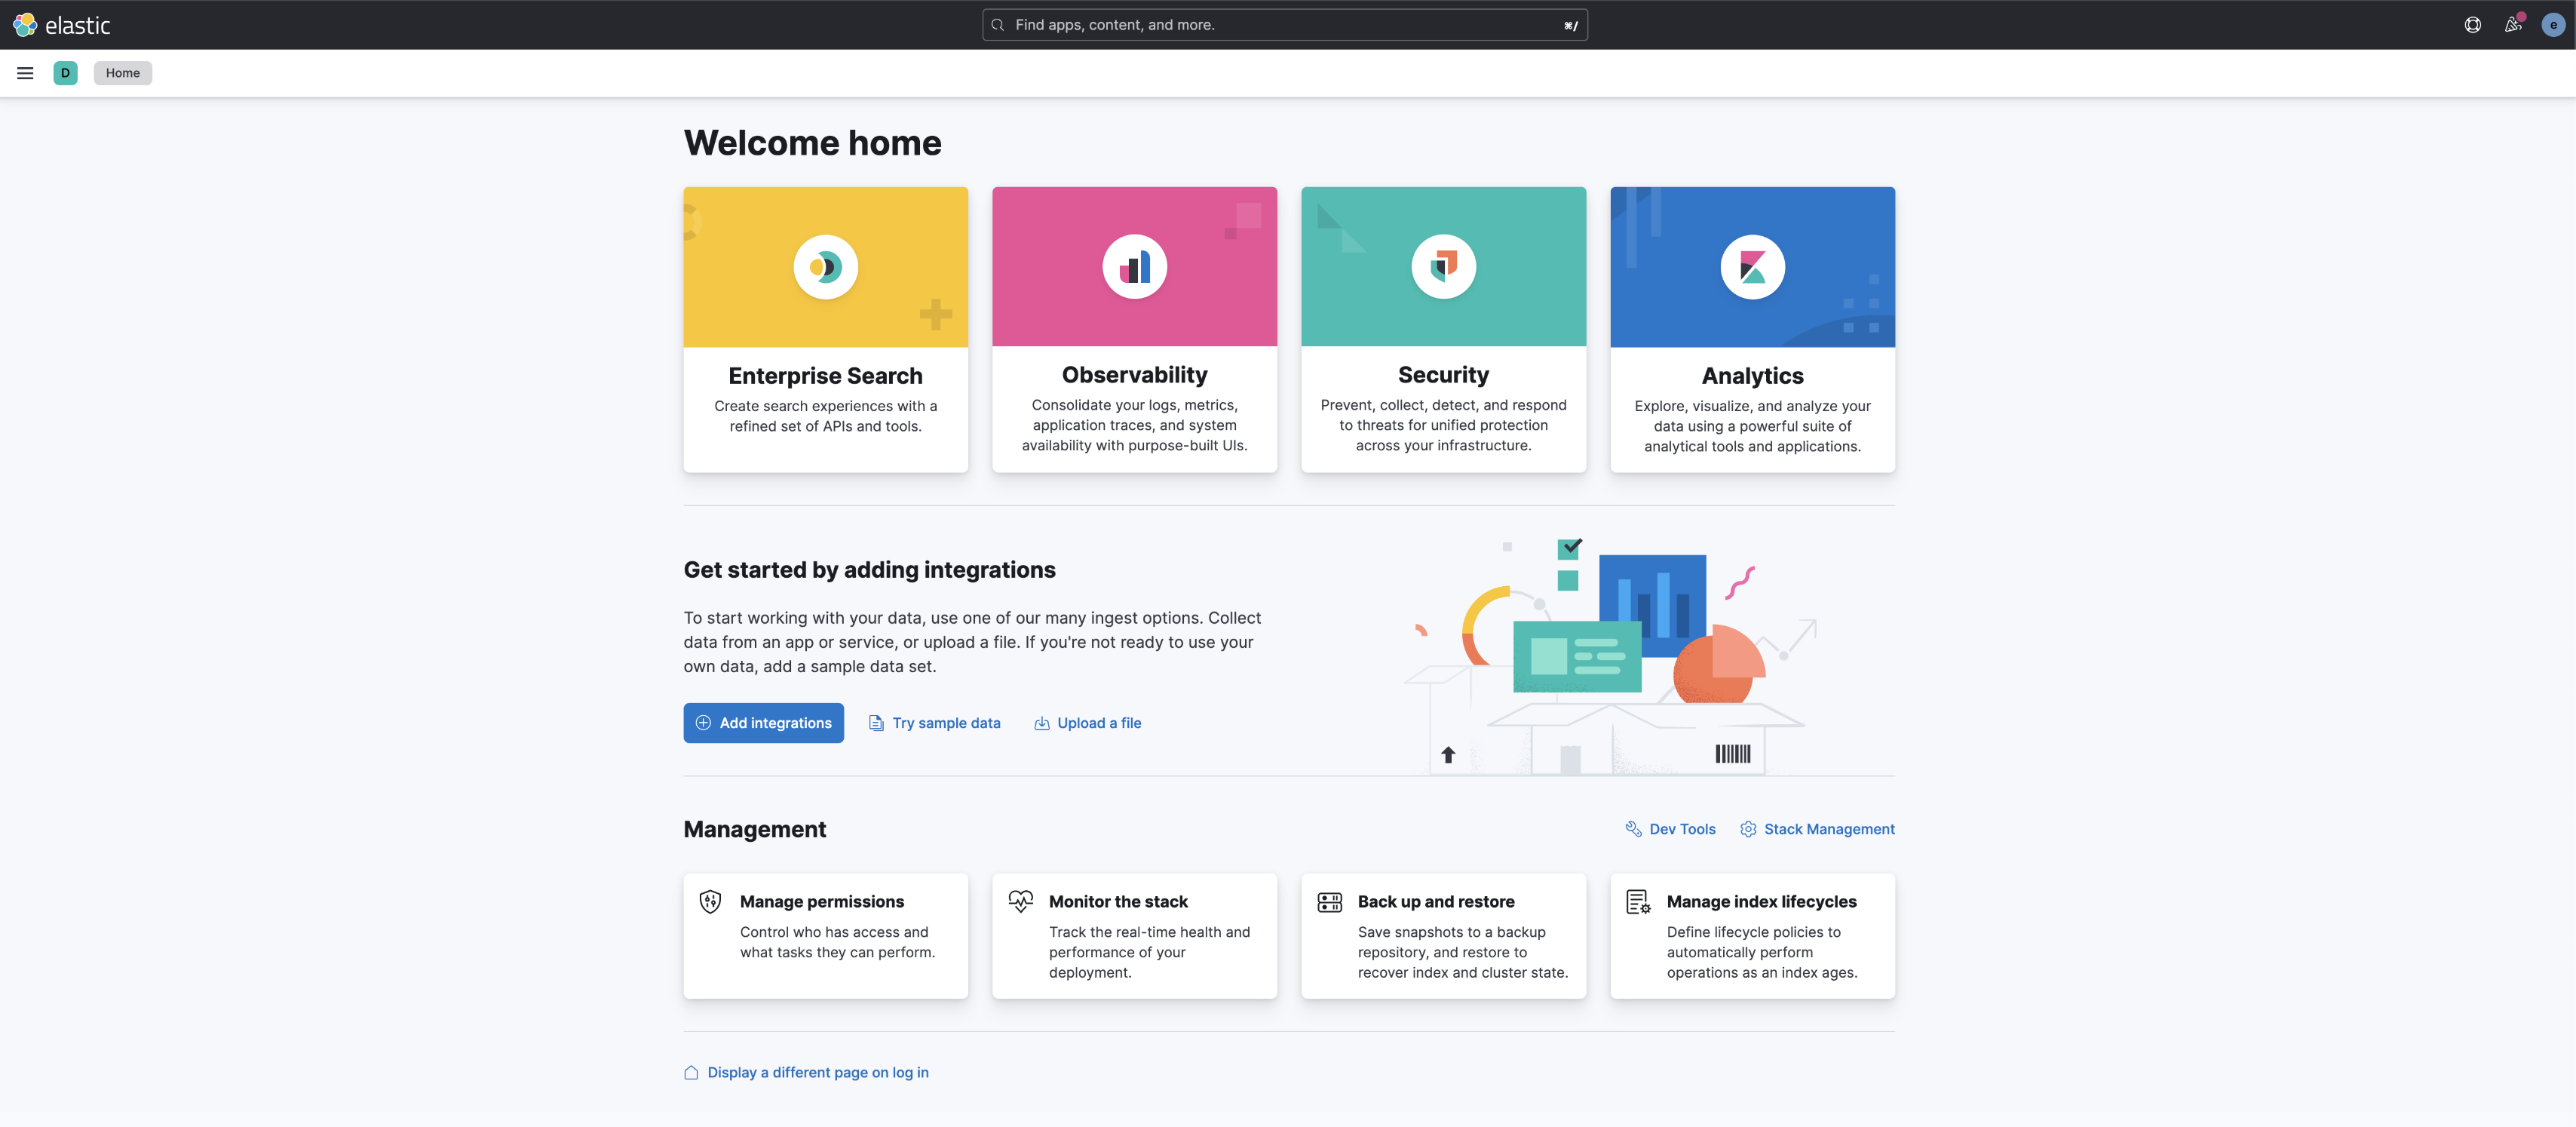
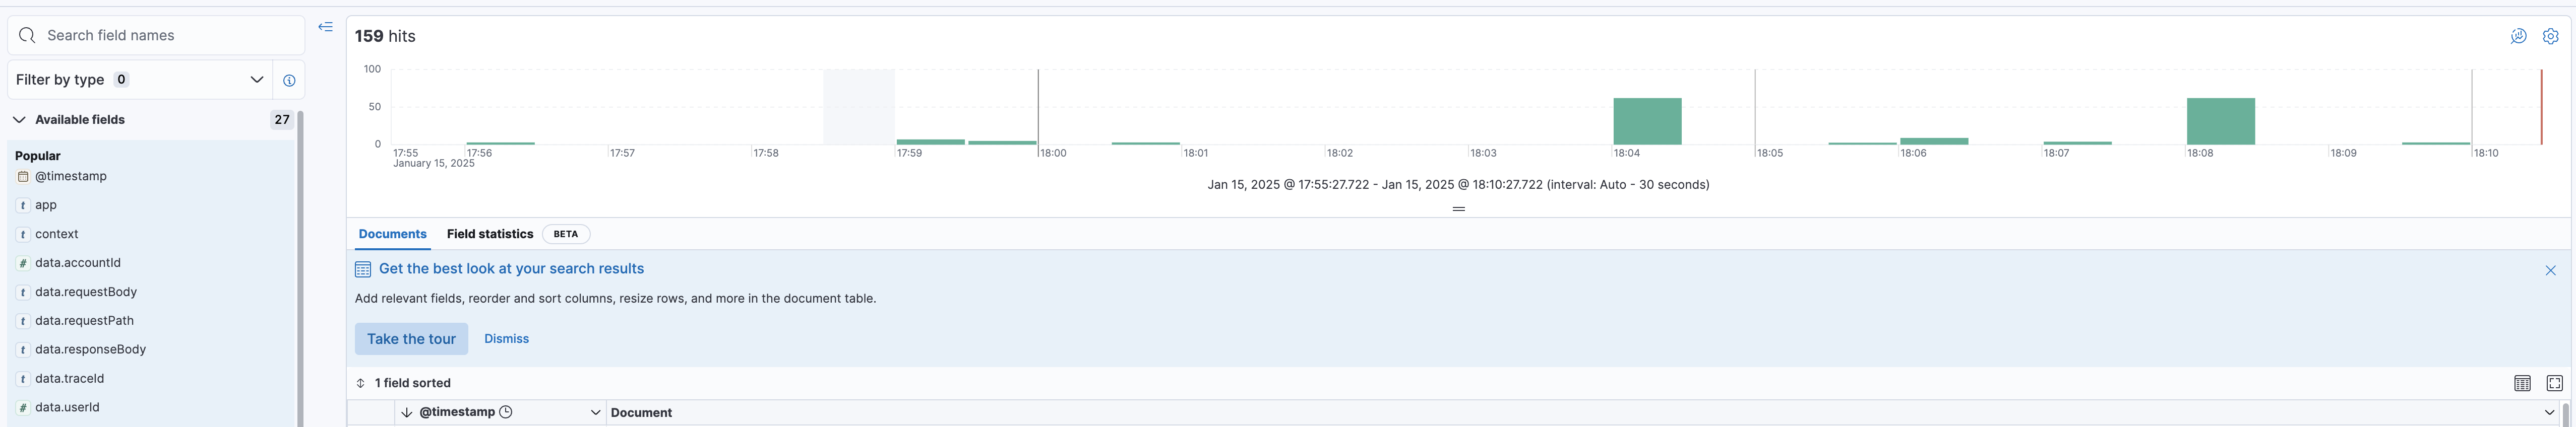
Verify in Kibana
Create a Discover view in Kibana that matches your index pattern to visualize the collected logs:
Important Considerations
Be mindful of these critical factors when operating an ELK Stack:
Elasticsearch Health Status
The cluster health status is a key indicator of your Elasticsearch setup:
- Green: All primary and replica shards are allocated
- Yellow: All primary shards are allocated, but some replica shards are not
- Red: Some primary shards are not allocated, data is unavailable
Configuration examples:
# For multiple node clusters (aim for green status)
clusterHealthCheckParams: "wait_for_status=green&timeout=1s"

# For single node clusters (yellow is normal and acceptable)
clusterHealthCheckParams: "wait_for_status=yellow&timeout=1s"
- Note: Single node clusters will typically have yellow status because replicas cannot be allocated on the same node as their primary shards
Component Dependencies
Kibana-Elasticsearch Dependency
- Kibana is completely dependent on Elasticsearch for all operations
- If Elasticsearch becomes unavailable, Kibana will be inaccessible
- Always monitor Elasticsearch health to ensure Kibana availability<
- Consider implementing Elasticsearch high availability for critical environments
Filebeat Performance Management
Filebeat Load Considerations
- Full log collection across all pods can cause significant system load
- Use selective log collection by targeting specific pods when possible
- Configure appropriate harvester limits to avoid excessive resource consumption
- Implement log rotation policies to prevent excessive disk usage<
- Consider using multiline settings for application logs that span multiple lines
Operator Installation Best Practices
ECK Operator Guidance
- Carefully analyze the eck-operator-crds before installation
- Follow the official documentation for proper operator setup
- Be aware of RBAC requirements for the operator
- Consider namespace isolation for multi-tenant environments
- Plan upgrade paths carefully as operator upgrades may impact existing resources
Key Points
-
Core Components
- Elasticsearch: Distributed search and analytics engine
- Logstash: Data collection and processing pipeline
- Kibana: Data visualization and exploration platform
- Filebeat: Lightweight log shipper -
Installation Approaches
- Archived Helm Charts: Simpler for development environments
- ECK Operator: More powerful for production deployments
- Follow proper component installation order -
Operational Considerations
- Monitor Elasticsearch health status
- Manage Filebeat load to prevent performance issues
- Understand component dependencies
- Implement proper security measures


Comments