29 min to read
Kubernetes Deployment Strategies
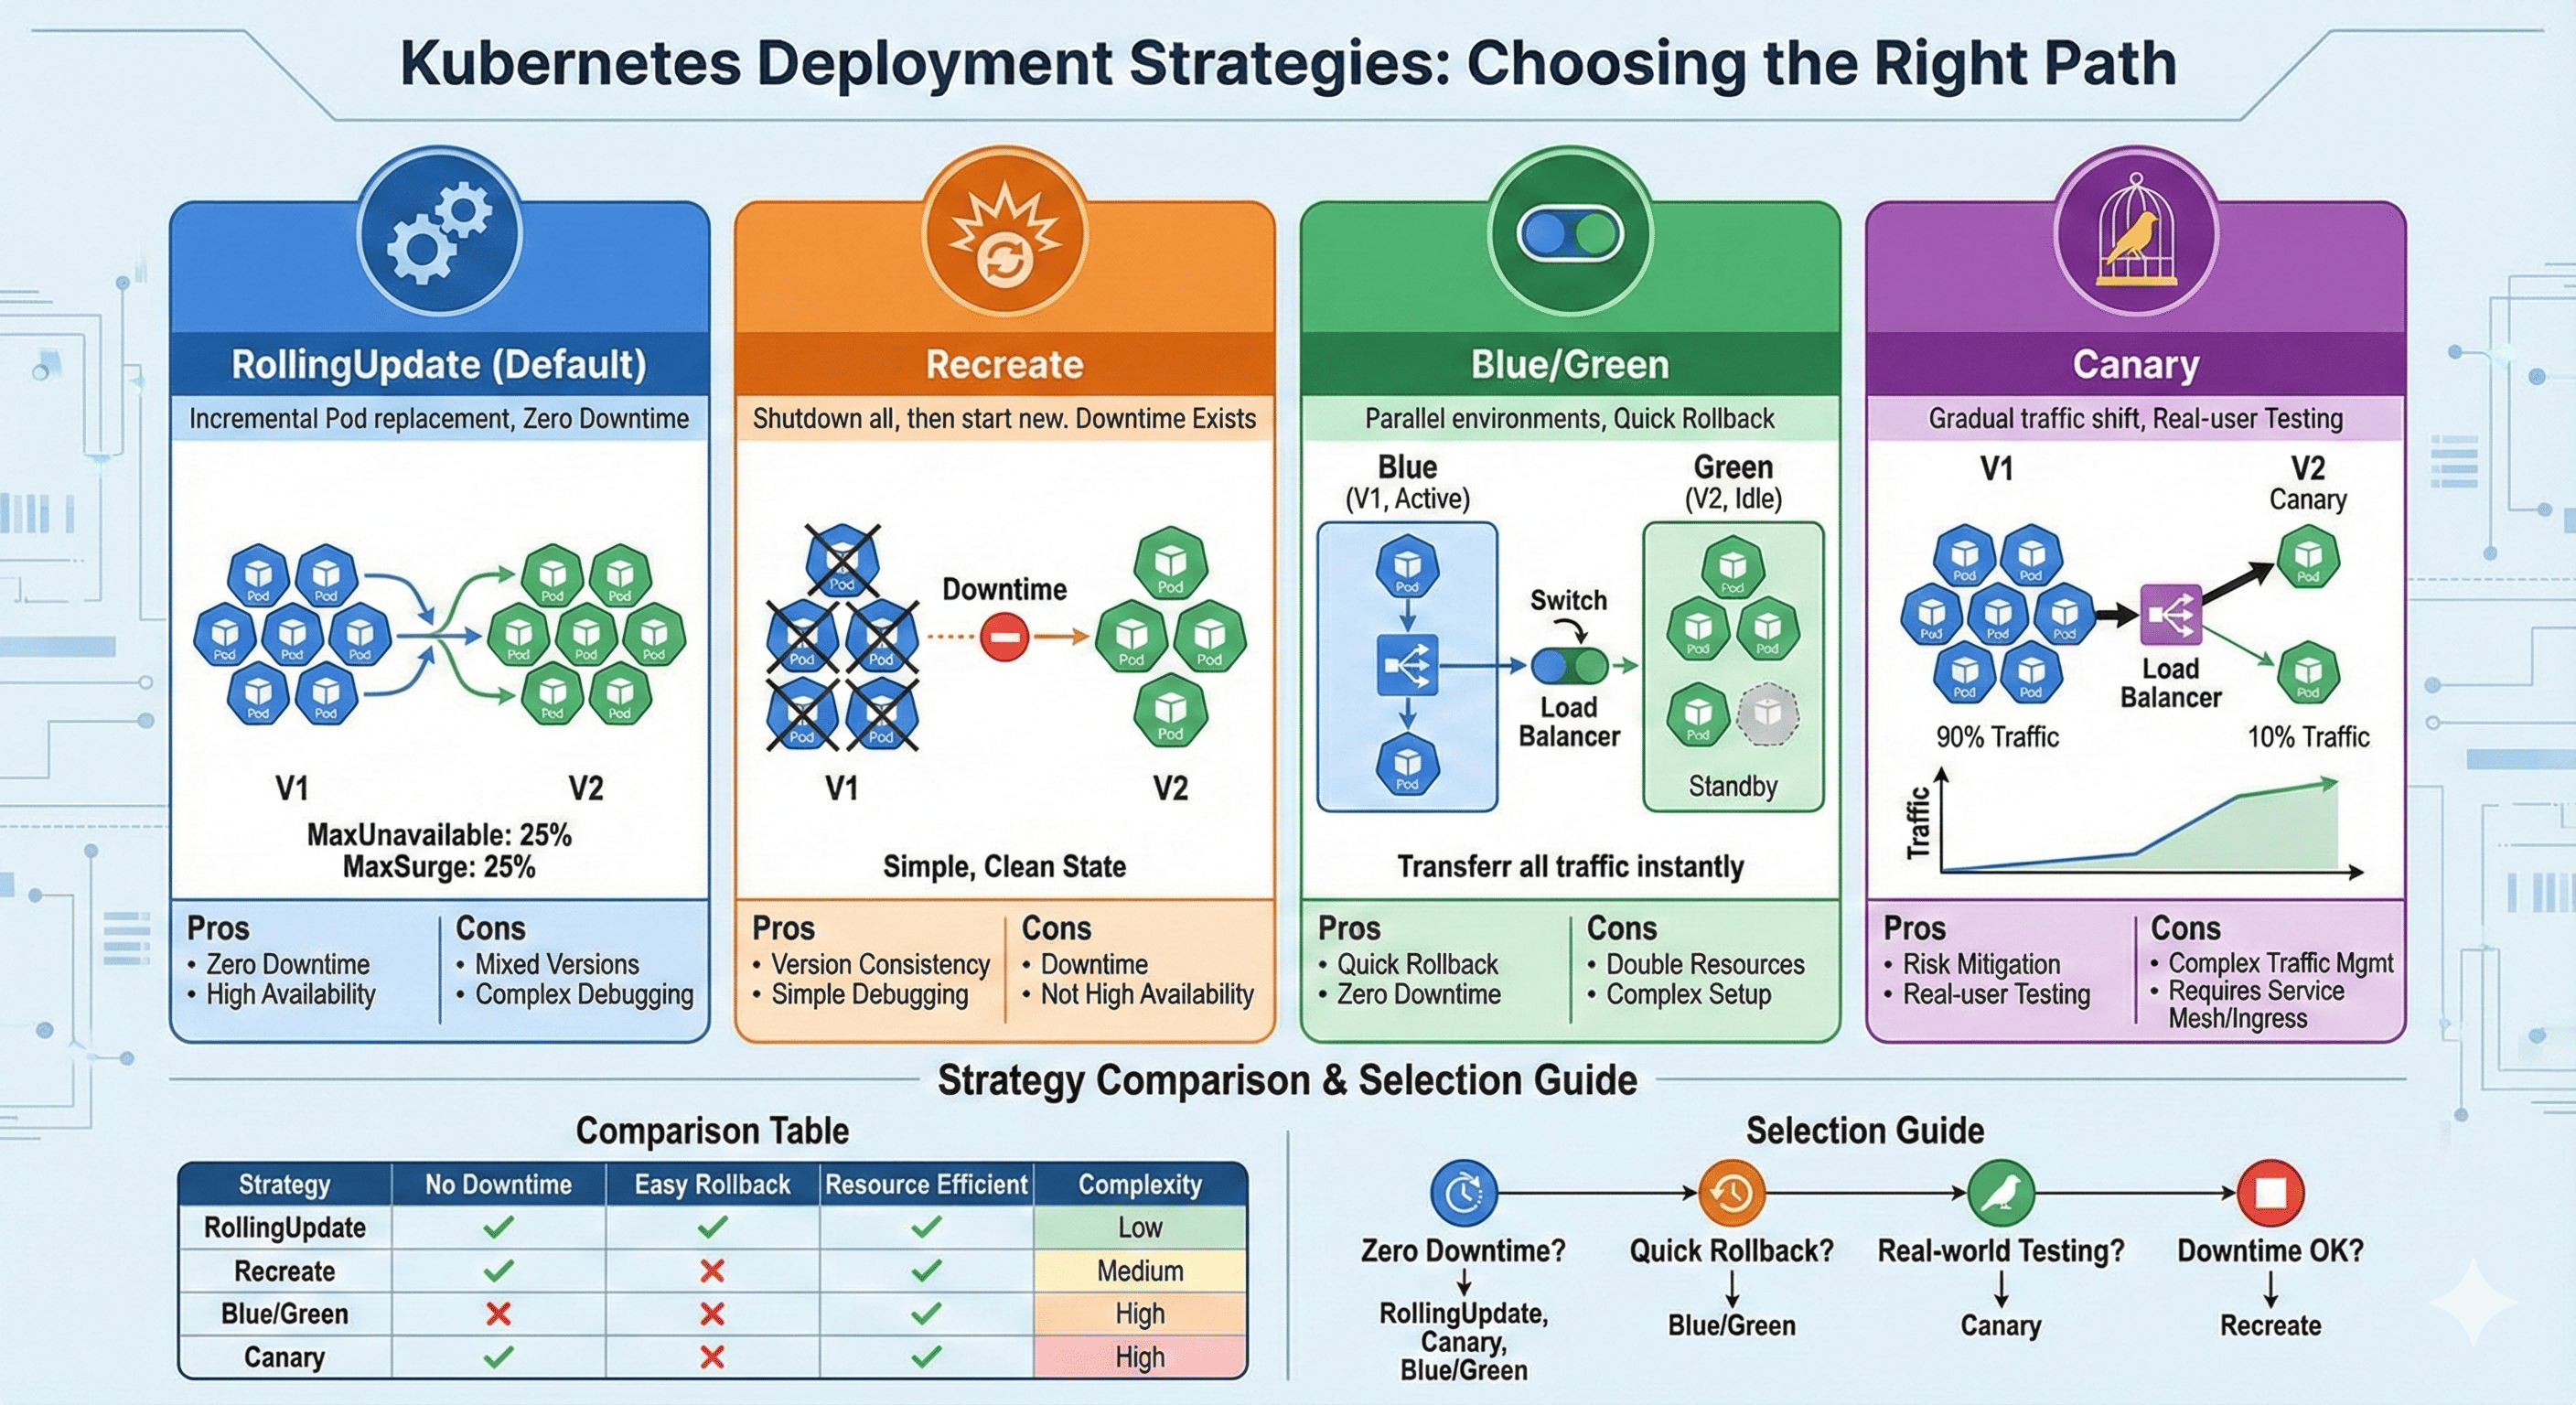
Choose the right approach for updating your applications with zero to minimal downtime
Overview
Kubernetes deployment strategies define how to update Pods or sets of Pods when deploying new application versions or container images. The right deployment strategy helps maintain system stability, minimize downtime, and ensure a smooth transition between versions.
When choosing a deployment strategy, consider these factors:
- Acceptable downtime window
- Application architecture compatibility
- Available resources
- Risk tolerance
- User impact
- Rollback requirements
Basic Deployment Strategies
1. RollingUpdate (Default)
The RollingUpdate strategy gradually replaces instances of the previous version with instances of the new version, one by one.
apiVersion: apps/v1
kind: Deployment
metadata:
  name: my-app
spec:
  replicas: 3
  strategy:
    type: RollingUpdate
    rollingUpdate:
      maxUnavailable: 1  # Maximum number of pods that can be unavailable during update
      maxSurge: 1        # Maximum number of pods that can be created above desired number
  selector:
    matchLabels:
      app: my-app
  template:
    metadata:
      labels:
        app: my-app
    spec:
      containers:
      - name: my-app
        image: my-app:v2
        ports:
        - containerPort: 8080
Key Parameters:
- maxUnavailable: Maximum number or percentage of pods that can be unavailable during the update
- maxSurge: Maximum number or percentage of pods that can be created over the desired number during the update
Benefits:
- Minimizes downtime during updates
- Provides continuous service availability
- Allows for gradual rollout of changes
- Built into Kubernetes, no additional tools required
Limitations:
- Both versions run simultaneously during the transition
- May cause issues if versions aren’t backward compatible
- Slower than recreate strategy
- Rollback requires another rolling update
2. Recreate Strategy
The Recreate strategy terminates all existing pods before creating new ones.
apiVersion: apps/v1
kind: Deployment
metadata:
  name: my-app
spec:
  replicas: 3
  strategy:
    type: Recreate
  selector:
    matchLabels:
      app: my-app
  template:
    metadata:
      labels:
        app: my-app
    spec:
      containers:
      - name: my-app
        image: my-app:v2
        ports:
        - containerPort: 8080
Benefits:
- Simple implementation
- Ensures clean state deployment
- Useful for applications with database schema changes
- No version overlap during deployment
- Minimal resource usage
Limitations:
- Creates downtime between versions
- Not suitable for production applications requiring high availability
- Impacts user experience during updates
Strategy Comparison
| Strategy | Downtime | Resource Usage | Complexity | Rollback Speed | Best For |
|---|---|---|---|---|---|
| RollingUpdate | Minimal | Normal | Low | Gradual | General-purpose applications with backward compatibility |
| Recreate | Yes | Minimal | Very Low | Immediate | Development environments, major version changes |
| Blue/Green | None | Double | High | Immediate | Mission-critical applications requiring zero downtime |
| Canary | None | Variable | High | Simple | Risk-sensitive applications needing gradual validation |
Advanced Deployment Strategies
1. Blue/Green Deployment
Blue/Green deployment maintains two identical environments, with only one serving production traffic at a time.
Version 1] D[Green Environment
Version 2] end subgraph "After Switch" E[Service] -->|Traffic Switched| G[Green Environment
Version 2] F[Blue Environment
Version 1] end style C fill:#1E88E5,stroke:#0D47A1,color:#FFF style G fill:#43A047,stroke:#2E7D32,color:#FFF
Implementation in Kubernetes:
# Blue deployment
apiVersion: apps/v1
kind: Deployment
metadata:
  name: my-app-blue
spec:
  replicas: 3
  selector:
    matchLabels:
      app: my-app
      version: blue
  template:
    metadata:
      labels:
        app: my-app
        version: blue
    spec:
      containers:
      - name: my-app
        image: my-app:v1
        ports:
        - containerPort: 8080
---
# Green deployment
apiVersion: apps/v1
kind: Deployment
metadata:
  name: my-app-green
spec:
  replicas: 3
  selector:
    matchLabels:
      app: my-app
      version: green
  template:
    metadata:
      labels:
        app: my-app
        version: green
    spec:
      containers:
      - name: my-app
        image: my-app:v2
        ports:
        - containerPort: 8080
---
# Service routing to blue (switch to green during deployment)
apiVersion: v1
kind: Service
metadata:
  name: my-app
spec:
  selector:
    app: my-app
    version: blue  # Switch between blue and green
  ports:
    - protocol: TCP
      port: 80
      targetPort: 8080
Switching Between Environments:
# Update service to point to green environment
kubectl patch service my-app -p '{"spec":{"selector":{"version":"green"}}}'

# To rollback, point back to blue environment
kubectl patch service my-app -p '{"spec":{"selector":{"version":"blue"}}}'
Benefits:
- Zero downtime during deployment
- Instant rollback capability
- Complete testing of new version before switching
- Users experience only one version at a time
Limitations:
- Requires double the resources
- Needs additional orchestration for database migrations
- More complex setup than native Kubernetes strategies
2. Canary Deployment
Canary deployment routes a small percentage of traffic to the new version for testing before full rollout.
v1] B --> |10%| D[Canary Version
v2] style C fill:#1E88E5,stroke:#0D47A1,color:#FFF style D fill:#FB8C00,stroke:#EF6C00,color:#FFF
Implementation Options:
1. Using Kubernetes Services and multiple deployments:
# Stable deployment
apiVersion: apps/v1
kind: Deployment
metadata:
  name: my-app-stable
spec:
  replicas: 9  # 90% of traffic
  selector:
    matchLabels:
      app: my-app
      track: stable
  template:
    metadata:
      labels:
        app: my-app
        track: stable
    spec:
      containers:
      - name: my-app
        image: my-app:v1
---
# Canary deployment
apiVersion: apps/v1
kind: Deployment
metadata:
  name: my-app-canary
spec:
  replicas: 1  # 10% of traffic
  selector:
    matchLabels:
      app: my-app
      track: canary
  template:
    metadata:
      labels:
        app: my-app
        track: canary
    spec:
      containers:
      - name: my-app
        image: my-app:v2
---
# Service routing to both deployments
apiVersion: v1
kind: Service
metadata:
  name: my-app
spec:
  selector:
    app: my-app  # Selects both stable and canary pods
  ports:
    - protocol: TCP
      port: 80
      targetPort: 8080
2. Using Ingress for HTTP traffic splitting:
# Ingress with canary annotations (NGINX ingress controller)
apiVersion: networking.k8s.io/v1
kind: Ingress
metadata:
  name: my-app-canary
  annotations:
    nginx.ingress.kubernetes.io/canary: "true"
    nginx.ingress.kubernetes.io/canary-weight: "20"
spec:
  rules:
  - host: myapp.example.com
    http:
      paths:
      - path: /
        pathType: Prefix
        backend:
          service:
            name: my-app-canary
            port:
              number: 80
3. Using a service mesh like Istio:
apiVersion: networking.istio.io/v1alpha3
kind: VirtualService
metadata:
  name: my-app
spec:
  hosts:
  - myapp.example.com
  http:
  - route:
    - destination:
        host: my-app-stable
        subset: v1
      weight: 80
    - destination:
        host: my-app-canary
        subset: v2
      weight: 20
Canary Implementation Approaches:
| Method | Pros | Cons |
|---|---|---|
| Pod ratio adjustment |
- Simple to implement - Works with any application |
- Less precise traffic control - Limited by pod granularity |
| Ingress controllers |
- More precise percentages - HTTP header-based routing |
- Only works for HTTP/HTTPS - Requires specific ingress controller |
| Service mesh (Istio) |
- Fine-grained traffic control - Advanced metrics and tracing - Multiple routing criteria |
- Complex to set up - Requires service mesh installation - Overhead in performance |
Benefits:
- Minimal risk exposure - issues only affect a small percentage of users
- Real-world testing with actual users
- Gradual rollout allows for performance and stability monitoring
- Controlled exposure of new features
Limitations:
- More complex to set up than basic strategies
- Requires additional traffic management tools or service mesh
- Monitoring overhead to detect issues
- May require coordinated database schema changes
Deployment Health Checks
Kubernetes uses probes to determine the health and readiness of your applications, which are critical for successful deployments.
1. Readiness Probe
Indicates when a pod is ready to accept traffic. During rolling updates, new pods won’t receive traffic until they pass readiness checks.
spec:
  containers:
  - name: my-app
    readinessProbe:
      httpGet:
        path: /health
        port: 8080
      initialDelaySeconds: 5
      periodSeconds: 10
      timeoutSeconds: 1
      successThreshold: 1
      failureThreshold: 3
Available Probe Types:
- HTTP GET: Performs an HTTP GET request
- TCP Socket: Tries to establish a TCP connection
- Exec: Executes a command in the container
2. Liveness Probe
Detects when a pod enters an unhealthy state and needs to be restarted.
spec:
  containers:
  - name: my-app
    livenessProbe:
      httpGet:
        path: /health
        port: 8080
      initialDelaySeconds: 15
      periodSeconds: 20
      timeoutSeconds: 1
      successThreshold: 1
      failureThreshold: 3
3. Startup Probe
Indicates when an application has started successfully, providing additional time for slow-starting containers.
spec:
  containers:
  - name: my-app
    startupProbe:
      httpGet:
        path: /health
        port: 8080
      failureThreshold: 30
      periodSeconds: 10
- initialDelaySeconds: Time to wait before first probe
- periodSeconds: How often to perform the probe
- timeoutSeconds: Probe timeout period
- successThreshold: Minimum consecutive successes to consider probe successful
- failureThreshold: Number of failures before giving up
Incorrect probe configuration can cause unnecessary restarts or prevent successful deployments!
Advanced Configuration and Tools
1. Progressive Delivery with Argo Rollouts
Argo Rollouts extends Kubernetes with advanced deployment strategies.
apiVersion: argoproj.io/v1alpha1
kind: Rollout
metadata:
  name: my-app-rollout
spec:
  replicas: 5
  strategy:
    canary:
      steps:
      - setWeight: 20
      - pause: {duration: 1h}
      - setWeight: 40
      - pause: {duration: 1h}
      - setWeight: 60
      - pause: {duration: 1h}
      - setWeight: 80
      - pause: {duration: 1h}
  selector:
    matchLabels:
      app: my-app
  template:
    metadata:
      labels:
        app: my-app
    spec:
      containers:
      - name: my-app
        image: my-app:v2
2. Advanced A/B Testing Configuration
A/B testing allows directing specific users to different versions based on criteria.
apiVersion: networking.k8s.io/v1
kind: Ingress
metadata:
  annotations:
    nginx.ingress.kubernetes.io/canary: "true"
    nginx.ingress.kubernetes.io/canary-by-header: "User-Country"
    nginx.ingress.kubernetes.io/canary-by-header-value: "US"
spec:
  rules:
  - host: myapp.example.com
    http:
      paths:
      - path: /
        pathType: Prefix
        backend:
          service:
            name: my-app-experiment
            port:
              number: 80
3. Deployment Protection with Pod Disruption Budget (PDB)
PDBs ensure minimum available replicas during voluntary disruptions like deployments.
apiVersion: policy/v1
kind: PodDisruptionBudget
metadata:
  name: my-app-pdb
spec:
  minAvailable: 2  # or use maxUnavailable: 1
  selector:
    matchLabels:
      app: my-app
Common Pitfalls and Best Practices
Common Issues to Avoid
- Resource constraints: Insufficient CPU/memory requests or limits
- Probe misconfiguration: Aggressive timeouts or inappropriate health checks
- Image issues: Using 'latest' tag or unreliable registries
- Database schema changes: Not planning for backward compatibility
- No rollback plan: Not preserving revision history
- Insufficient monitoring: Inability to detect deployment issues
- Network policy issues: Blocking required communication paths
- Security context misconfigurations: Running containers with excessive privileges
- Volume mount issues: Incorrect persistent volume configurations
Debugging Failed Deployments
When deployments fail, follow this systematic troubleshooting approach:
# Check deployment status and events
kubectl describe deployment my-app

# View pod details and events
kubectl describe pod <pod-name>

# Check pod logs
kubectl logs <pod-name> --previous  # For crashed containers
kubectl logs <pod-name> -c <container-name>  # For multi-container pods

# Check resource availability
kubectl top nodes
kubectl top pods

# Verify service endpoints
kubectl describe service my-app
kubectl get endpoints my-app

# Check for network policy restrictions
kubectl describe networkpolicy
Common Error Messages and Solutions:
| Error Message | Cause | Solution |
|---|---|---|
| ImagePullBackOff | Cannot pull container image |
- Check image name and tag - Verify registry credentials - Ensure image exists in registry |
| CrashLoopBackOff | Container keeps crashing |
- Check application logs - Verify resource limits - Review startup probe configuration |
| Insufficient resources | Not enough CPU/memory |
- Adjust resource requests - Scale cluster nodes - Optimize application resources |
| Readiness probe failed | Health check failing |
- Verify health endpoint - Adjust probe timeouts - Check application startup time |
Best Practices for Successful Deployments
- Version control: Use specific immutable image tags, never 'latest'
- Proper health checks: Implement meaningful readiness/liveness probes
- Resource planning: Set appropriate CPU and memory requests/limits
- Automated testing: Run thorough tests before deployment
- Monitoring: Implement metrics for deployment success rates and performance
- Rollback readiness: Maintain revision history and test rollback procedures
- Documentation: Document deployment procedures, dependencies, and requirements
- Small, frequent updates: Prefer smaller, incremental changes over large updates
- Environment parity: Keep development, staging, and production environments consistent
- Security scanning: Scan container images for vulnerabilities before deployment
- Backup strategy: Ensure data backup before major deployments
Deployment Checklist
Before deploying to production, ensure you’ve completed this checklist:
- Code reviewed and approved
- All tests passing (unit, integration, e2e)
- Container image built with specific version tag
- Image scanned for security vulnerabilities
- Image pushed to secure registry
- Environment variables configured
- Secrets and ConfigMaps updated
- Resource requests and limits defined
- Health check endpoints tested
- Database migrations planned (if needed)
- Security context configured appropriately
- Network policies reviewed
- RBAC permissions verified
- Compliance requirements met
- Metrics and logging configured
- Alerting rules defined
- Dashboard updated for new version
- SLI/SLO targets defined
- Rollback procedure documented
- Data backup completed
- Previous version available for quick rollback
- Communication plan for stakeholders
Advanced Resource Management
Configure resource quotas and limits to prevent deployment issues:
# Resource quota for namespace
apiVersion: v1
kind: ResourceQuota
metadata:
  name: deployment-quota
  namespace: production
spec:
  hard:
    requests.cpu: "10"
    requests.memory: 20Gi
    limits.cpu: "20"
    limits.memory: 40Gi
    persistentvolumeclaims: "10"
    services: "20"
    secrets: "100"
    configmaps: "100"
---
# Limit range for pods
apiVersion: v1
kind: LimitRange
metadata:
  name: pod-limit-range
  namespace: production
spec:
  limits:
  - default:
      cpu: 500m
      memory: 512Mi
    defaultRequest:
      cpu: 100m
      memory: 128Mi
    type: Container
Monitoring Deployments
Proper monitoring is essential for successful deployments and quick reaction to issues.
Key Metrics to Monitor
| Metric Type | Examples | Why Monitor |
|---|---|---|
| Application Performance |
- Response time - Error rate - Throughput |
Detect performance regressions with new version |
| Resource Utilization |
- CPU usage - Memory consumption - Network traffic |
Identify resource leaks or inefficiencies |
| Deployment Status |
- Pod status - Rollout progress - Availability |
Track deployment progress and success |
| Business Metrics |
- Conversion rates - User engagement - Transaction volume |
Measure business impact of deployment |
Deployment Observability Stack
A comprehensive observability setup includes metrics, logs, and traces:
1. Metrics Collection with Prometheus
# ServiceMonitor for application metrics
apiVersion: monitoring.coreos.com/v1
kind: ServiceMonitor
metadata:
  name: my-app-metrics
spec:
  selector:
    matchLabels:
      app: my-app
  endpoints:
  - port: metrics
    interval: 30s
    path: /metrics
---
# Deployment with metrics endpoint
apiVersion: apps/v1
kind: Deployment
metadata:
  name: my-app
  labels:
    app: my-app
spec:
  replicas: 3
  selector:
    matchLabels:
      app: my-app
  template:
    metadata:
      labels:
        app: my-app
      annotations:
        prometheus.io/scrape: "true"
        prometheus.io/port: "8080"
        prometheus.io/path: "/metrics"
    spec:
      containers:
      - name: my-app
        image: my-app:v2
        ports:
        - containerPort: 8080
          name: http
        - containerPort: 8081
          name: metrics
        env:
        - name: METRICS_PORT
          value: "8081"
2. Structured Logging Configuration
# ConfigMap for logging configuration
apiVersion: v1
kind: ConfigMap
metadata:
  name: app-logging-config
data:
  log-config.json: |
    {
      "level": "info",
      "format": "json",
      "output": "stdout",
      "fields": {
        "service": "my-app",
        "version": "${APP_VERSION}",
        "environment": "${ENVIRONMENT}"
      }
    }
---
# Deployment with logging sidecar
apiVersion: apps/v1
kind: Deployment
metadata:
  name: my-app-with-logging
spec:
  replicas: 3
  selector:
    matchLabels:
      app: my-app
  template:
    metadata:
      labels:
        app: my-app
    spec:
      containers:
      - name: my-app
        image: my-app:v2
        volumeMounts:
        - name: log-config
          mountPath: /etc/logging
        - name: shared-logs
          mountPath: /var/log/app
      - name: log-shipper
        image: fluent/fluent-bit:latest
        volumeMounts:
        - name: shared-logs
          mountPath: /var/log/app
        - name: fluent-bit-config
          mountPath: /fluent-bit/etc
      volumes:
      - name: log-config
        configMap:
          name: app-logging-config
      - name: shared-logs
        emptyDir: {}
      - name: fluent-bit-config
        configMap:
          name: fluent-bit-config
3. Distributed Tracing with Jaeger
# Deployment with tracing enabled
apiVersion: apps/v1
kind: Deployment
metadata:
  name: my-app-traced
spec:
  replicas: 3
  selector:
    matchLabels:
      app: my-app
  template:
    metadata:
      labels:
        app: my-app
      annotations:
        sidecar.jaegertracing.io/inject: "true"
    spec:
      containers:
      - name: my-app
        image: my-app:v2
        env:
        - name: JAEGER_AGENT_HOST
          value: "jaeger-agent.monitoring.svc.cluster.local"
        - name: JAEGER_AGENT_PORT
          value: "6831"
        - name: JAEGER_SAMPLER_TYPE
          value: "probabilistic"
        - name: JAEGER_SAMPLER_PARAM
          value: "0.1"
Example Prometheus Queries
# Success rate of HTTP requests
sum(rate(http_requests_total{status=~"2.."}[5m])) / sum(rate(http_requests_total[5m]))

# Error rate change after deployment
sum(rate(http_requests_total{status=~"5.."}[5m])) / sum(rate(http_requests_total[5m]))

# Response time percentiles
histogram_quantile(0.95, sum(rate(http_request_duration_seconds_bucket[5m])) by (le))

# Container restarts during deployment
sum(changes(container_start_time_seconds[1h])) by (pod)

# Deployment success rate
sum(rate(kube_deployment_status_replicas_updated[5m])) / sum(rate(kube_deployment_spec_replicas[5m]))

# Pod readiness during rollout
sum(kube_pod_status_ready{condition="true"}) by (deployment)

# Memory usage trend
avg(container_memory_usage_bytes{container="my-app"}) by (pod)

# CPU throttling detection
sum(rate(container_cpu_cfs_throttled_seconds_total[5m])) by (pod)
Advanced Alerting Rules
Visualizing Deployments
Conclusion and Strategy Selection
The choice of deployment strategy depends on your specific requirements, with tradeoffs between simplicity, downtime, resource usage, and risk.
Quick Strategy Selection Guide
Use this decision matrix to quickly choose the appropriate deployment strategy:
| Scenario | Recommended Strategy | Reasoning |
|---|---|---|
| Development environment | Recreate | Simple, fast, downtime acceptable |
| Small web application | RollingUpdate | Built-in, minimal downtime, resource efficient |
| Mission-critical e-commerce | Blue/Green | Zero downtime, instant rollback capability |
| Machine learning model | Canary | Gradual validation with real data, A/B testing |
| Database schema change | Blue/Green + Migration | Safe data migration, immediate rollback |
| Microservice with dependencies | Canary + Circuit Breaker | Gradual rollout, dependency isolation |
Deployment Automation and CI/CD Integration
GitLab CI/CD Pipeline Example
# .gitlab-ci.yml
stages:
  - build
  - test
  - security
  - deploy-staging
  - deploy-canary
  - deploy-production

variables:
  DOCKER_REGISTRY: "registry.gitlab.com"
  KUBERNETES_NAMESPACE: "production"

build:
  stage: build
  script:
    - docker build -t $DOCKER_REGISTRY/$CI_PROJECT_PATH:$CI_COMMIT_SHA .
    - docker push $DOCKER_REGISTRY/$CI_PROJECT_PATH:$CI_COMMIT_SHA

security-scan:
  stage: security
  script:
    - trivy image $DOCKER_REGISTRY/$CI_PROJECT_PATH:$CI_COMMIT_SHA

deploy-staging:
  stage: deploy-staging
  script:
    - kubectl set image deployment/my-app my-app=$DOCKER_REGISTRY/$CI_PROJECT_PATH:$CI_COMMIT_SHA -n staging
    - kubectl rollout status deployment/my-app -n staging --timeout=300s
  environment:
    name: staging
    url: https://staging.myapp.com

deploy-canary:
  stage: deploy-canary
  script:
    - |
      cat <<EOF | kubectl apply -f -
      apiVersion: apps/v1
      kind: Deployment
      metadata:
        name: my-app-canary
        namespace: $KUBERNETES_NAMESPACE
      spec:
        replicas: 1
        selector:
          matchLabels:
            app: my-app
            track: canary
        template:
          metadata:
            labels:
              app: my-app
              track: canary
          spec:
            containers:
            - name: my-app
              image: $DOCKER_REGISTRY/$CI_PROJECT_PATH:$CI_COMMIT_SHA
      EOF
    - kubectl rollout status deployment/my-app-canary -n $KUBERNETES_NAMESPACE
  when: manual
  only:
    - main

deploy-production:
  stage: deploy-production
  script:
    - kubectl set image deployment/my-app my-app=$DOCKER_REGISTRY/$CI_PROJECT_PATH:$CI_COMMIT_SHA -n $KUBERNETES_NAMESPACE
    - kubectl rollout status deployment/my-app -n $KUBERNETES_NAMESPACE --timeout=600s
  when: manual
  only:
    - main
  environment:
    name: production
    url: https://myapp.com
Helm-based Deployment Strategy
# values.yaml for different environments
# values-staging.yaml
replicaCount: 2
image:
  repository: my-app
  tag: latest
strategy:
  type: RollingUpdate
  rollingUpdate:
    maxUnavailable: 1
    maxSurge: 1

# values-production.yaml
replicaCount: 5
image:
  repository: my-app
  tag: stable
strategy:
  type: RollingUpdate
  rollingUpdate:
    maxUnavailable: 1
    maxSurge: 2

# Canary values
canary:
  enabled: true
  weight: 10
  analysis:
    successRate: 95
    interval: 30s
    threshold: 5
Argo CD Application Configuration
apiVersion: argoproj.io/v1alpha1
kind: Application
metadata:
  name: my-app
  namespace: argocd
spec:
  project: default
  source:
    repoURL: https://github.com/my-org/my-app
    targetRevision: HEAD
    path: k8s/overlays/production
  destination:
    server: https://kubernetes.default.svc
    namespace: production
  syncPolicy:
    automated:
      prune: true
      selfHeal: true
    syncOptions:
    - CreateNamespace=true
    retry:
      limit: 5
      backoff:
        duration: 5s
        factor: 2
        maxDuration: 3m
Final Recommendations
Based on industry best practices and real-world experience:
- Start with RollingUpdate for simplicity
- Implement proper health checks early
- Use managed Kubernetes services (EKS, GKE, AKS)
- Focus on monitoring and alerting
- Implement Blue/Green for critical services
- Use Canary for new features and ML models
- Invest in comprehensive observability stack
- Establish deployment governance and approval processes
- Combine multiple strategies based on service criticality
- Implement automated rollback based on SLI violations
- Use progressive delivery tools (Argo Rollouts, Flagger)
- Maintain deployment velocity with safety guardrails
Remember: The best deployment strategy is the one that balances your risk tolerance, operational complexity, and business requirements while maintaining the ability to deliver features quickly and safely.
References
- Kubernetes Official Documentation - Deployments
- Kubernetes Official Documentation - Container Probes
- Spacelift Deployment Strategies
- Argo Rollouts Documentation
- Istio Traffic Management
- Flagger - Progressive Delivery Operator
- CNCF Landscape - Continuous Delivery
- Prometheus Operator Documentation
- Jaeger Tracing Documentation
- Helm Best Practices
- GitOps Working Group
- DevOps Engineer Wiki
Additional Resources
Tools and Platforms
- Progressive Delivery: Argo Rollouts, Flagger, Keptn
- Service Mesh: Istio, Linkerd, Consul Connect
- Monitoring: Prometheus, Grafana, Datadog
- CI/CD: GitLab CI, GitHub Actions, Jenkins X

Comments