28 min to read
Cilium Deep Dive - Advanced eBPF-based Kubernetes Networking and Security
From installation to advanced network policies, observability, and traffic analysis with Cilium and Hubble
Overview
This comprehensive guide explores Cilium, from basic concepts to installation, configuration, observability, policy implementation, and network traffic flow analysis through hands-on practice.
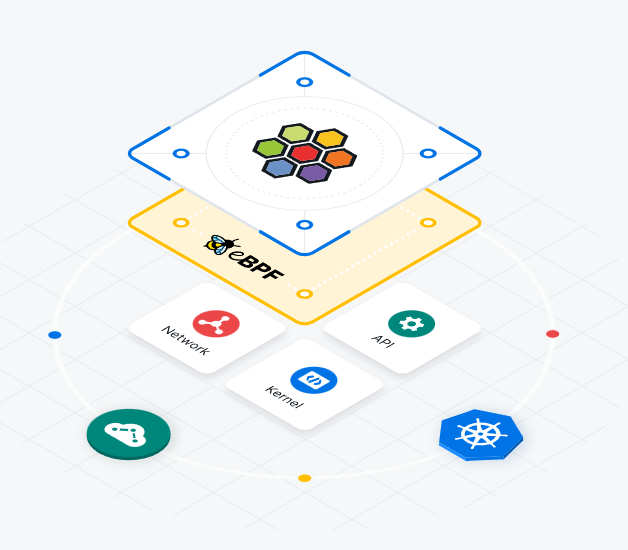
Cilium is a Kubernetes networking and security solution that leverages eBPF (Extended Berkeley Packet Filter) technology to provide higher performance, enhanced security, and sophisticated observability compared to traditional iptables-based CNI solutions.
Beyond being a simple CNI plugin, Cilium provides the following key capabilities:
- High-performance network policy control
- L7 (HTTP/gRPC) based policy support
- Real-time traffic observation and visualization through Hubble
- Sidecar-free Kubernetes service mesh implementation
- Seamless integration with Kubernetes
Through this hands-on guide, we’ll install Cilium with Kubespray, observe various network policies and traffic flows in real-time, and gain a practical understanding of Cilium’s operational model.
What is Cilium?
Cilium is an open-source software solution designed to provide, secure, and observe network connectivity between container workloads. Developed with a focus on cloud-native environments, Cilium is particularly well-suited for applications running in Kubernetes.
Core Architecture and eBPF Foundation
Cilium leverages eBPF (Extended Berkeley Packet Filter), a powerful technology that enables advanced networking, security, and load balancing functions to be performed directly within the Linux kernel without requiring traditional overlay networks.
Key Features and Capabilities
| Feature Area | Capabilities |
|---|---|
| Networking & Security |
|
| eBPF Technology |
|
| Observability & Monitoring |
|
| Security Policies |
|
| Cloud Native Integration |
|
| Scalability & Performance |
|
Cilium Architecture Components
Understanding Cilium’s architecture is crucial for effective deployment and troubleshooting. Each component has specific responsibilities in the overall networking and security infrastructure.
Core Components
| Component | Purpose | Functionality |
|---|---|---|
| Cilium Agent | Node-level networking and policy enforcement |
|
| Cilium Operator | Cluster-wide operations and coordination |
|
| Cilium CLI | Administrative interface and debugging |
|
| CNI Plugin | Kubernetes integration interface |
|
| Hubble | Network observability and monitoring |
|
Component Interaction Flow
Understanding eBPF Technology
eBPF (Extended Berkeley Packet Filter) forms the technological foundation of Cilium’s capabilities. Understanding eBPF is essential for comprehending Cilium’s advantages and operational model.
What is eBPF?
Revolutionary Kernel Programming
eBPF is a revolutionary technology that allows user-written programs to run safely within the Linux kernel without requiring kernel modifications or module loading.
- Origin: Evolved from the original Berkeley Packet Filter for network packet inspection
- Evolution: Now a general-purpose kernel programming technology
- Safety: Kernel verifier ensures program safety before execution
- Performance: Minimal user-space to kernel-space context switching
eBPF Characteristics and Benefits
| Characteristic | Description and Benefits |
|---|---|
| High Performance |
|
| Kernel Stability |
|
| Dynamic Updates |
|
| API Stability |
|
eBPF Use Cases in Cilium
Traditional vs eBPF-based Networking
| Aspect | Traditional (iptables) | eBPF-based (Cilium) |
|---|---|---|
| Performance |
|
|
| Flexibility |
|
|
| Observability |
|
|
Cilium Installation with Kubespray
This section demonstrates how to install Kubernetes with Cilium as the CNI using Kubespray, providing a production-ready foundation for advanced networking capabilities.
System Requirements and Configuration
| Component | Specifications |
|---|---|
| Operating System | Ubuntu 20.04 LTS (Focal) on Google Compute Engine |
| Master Node |
|
| Worker Node |
|
Infrastructure Setup with Terraform
Prerequisites and Environment Setup
# SSH key generation and distribution
ssh-keygen
ssh-copy-id somaz@10.77.101.57

# Configure /etc/hosts for hostname resolution
cat >> /etc/hosts << EOF
10.77.101.62 test-server
10.77.101.57 test-server-agent
EOF

# Verify SSH connectivity
ssh test-server-agent

# Install Python 3.10 (Critical for Kubespray compatibility)
sudo add-apt-repository ppa:deadsnakes/ppa
sudo apt-get update
sudo apt install -y python3.10 python3-pip git python3.10-venv

# Verify Python version
python3.10 --version  # Should output: Python 3.10.13
Kubespray Deployment Process
# Clone Kubespray repository and setup environment
git clone https://github.com/kubernetes-sigs/kubespray.git

VENVDIR=kubespray-venv
KUBESPRAYDIR=kubespray
python3.10 -m venv $VENVDIR
source $VENVDIR/bin/activate
cd $KUBESPRAYDIR

# Install dependencies
pip install -U -r requirements.txt

# Prepare Ansible inventory
cp -rfp inventory/sample inventory/somaz-cluster

# Generate inventory with IP addresses
declare -a IPS=(10.77.101.62 10.77.101.57)
CONFIG_FILE=inventory/somaz-cluster/hosts.yaml python3 contrib/inventory_builder/inventory.py ${IPS[@]}
Cilium Configuration
# inventory/somaz-cluster/group_vars/k8s_cluster/k8s-cluster.yml
# Configure CNI to use Cilium instead of Calico
kube_network_plugin: cilium

# inventory/somaz-cluster/group_vars/k8s_cluster/addons.yml
# Enable essential addons
helm_enabled: true
ingress_nginx_enabled: true
metallb_enabled: true
metallb_protocol: "layer2"
metallb_config:
  address_pools:
    primary:
      ip_range:
        - 192.168.56.200-192.168.56.209  # Adjust IP range as needed
      auto_assign: true
  layer2:
    - primary

# inventory/somaz-cluster/group_vars/k8s_cluster/k8s-net-cilium.yml
# Enable Hubble for observability
cilium_enable_hubble: true
cilium_enable_hubble_metrics: true
cilium_hubble_metrics:
  - dns
  - drop
  - tcp
  - flow
  - icmp
  - http
cilium_hubble_install: true
cilium_hubble_tls_generate: true
Inventory Configuration
# inventory/somaz-cluster/inventory.ini
[all]
test-server ansible_host=10.77.101.62  ip=10.77.101.62
test-server-agent ansible_host=10.77.101.57  ip=10.77.101.57

[kube_control_plane]
test-server

[etcd]
test-server

[kube_node]
test-server-agent

[calico_rr]

[k8s_cluster:children]
kube_control_plane
kube_node
calico_rr
Deployment Execution
# Verify Ansible connectivity
ansible all -i inventory/somaz-cluster/inventory.ini -m ping

# Optional: Update apt cache on all nodes
ansible all -i inventory/somaz-cluster/inventory.ini -m apt -a 'update_cache=yes' --become

# Execute the deployment playbook
ansible-playbook -i inventory/somaz-cluster/inventory.ini cluster.yml --become
Post-Installation Setup
# Configure kubectl access
mkdir ~/.kube
sudo cp /etc/kubernetes/admin.conf ~/.kube/config
sudo chown $USER:$USER ~/.kube/config

# Set up kubectl completion and aliases
echo '# kubectl completion and alias' >> ~/.bashrc
echo 'source <(kubectl completion bash)' >> ~/.bashrc
echo 'alias k=kubectl' >> ~/.bashrc
echo 'complete -F __start_kubectl k' >> ~/.bashrc
source ~/.bashrc

# Verify cluster status
kubectl get nodes
kubectl cluster-info
kubectl get pods -n kube-system
Cilium CLI Installation
# Download and install Cilium CLI
curl -LO https://github.com/cilium/cilium-cli/releases/latest/download/cilium-linux-amd64.tar.gz
sudo tar xzvfC cilium-linux-amd64.tar.gz /usr/local/bin
rm cilium-linux-amd64.tar.gz

# Verify Cilium status
cilium status
Network Communication with Cilium CNI
Understanding how Cilium handles pod-to-pod and pod-to-service communication is crucial for troubleshooting and optimization. This section explores the detailed packet forwarding paths within Cilium’s architecture.
Cilium Network Interfaces
Interface Roles and Functions
| Interface | Purpose and Functionality |
|---|---|
| cilium_net |
|
| cilium_host |
|
| lxc interfaces |
|
Packet Flow Analysis
# Set up Cilium pod aliases for easier management
CILIUMPOD0=$(kubectl get pods -n kube-system -l k8s-app=cilium --field-selector spec.nodeName=test-server -o jsonpath='{.items[0].metadata.name}')
CILIUMPOD1=$(kubectl get pods -n kube-system -l k8s-app=cilium --field-selector spec.nodeName=test-server-agent -o jsonpath='{.items[0].metadata.name}')

# Create convenient aliases for Cilium CLI access
alias c0="kubectl exec -it $CILIUMPOD0 -n kube-system -- cilium"
alias c1="kubectl exec -it $CILIUMPOD1 -n kube-system -- cilium"

# Examine IP cache mappings
c0 map get cilium_ipcache

# View endpoint configurations
c0 endpoint list

# Monitor network policies
c0 bpf policy list

# Check endpoint health
c0 endpoint health <endpoint-id>
Understanding IPCache and Routing
The IPCache is a critical component that maintains mappings between IP addresses, security identities, and routing information.
# Example IPCache output analysis
c0 map get cilium_ipcache
# Key                Value                                                                  State   Error
# 0.0.0.0/0          identity=2 encryptkey=0 tunnelendpoint=0.0.0.0 nodeid=0                sync
# 10.233.64.153/32   identity=4 encryptkey=0 tunnelendpoint=10.77.101.57 nodeid=12111       sync
# 10.77.101.62/32    identity=1 encryptkey=0 tunnelendpoint=0.0.0.0 nodeid=0                sync
| IPCache Field | Description |
|---|---|
| Identity | Unique security identity assigned to endpoints based on labels |
| Encryptkey | Encryption key identifier for secure communication (0 = no encryption) |
| Tunnelendpoint | IP address of the tunnel endpoint for cross-node communication |
| Nodeid | Unique identifier for the node hosting the endpoint |
Network Policies and Security
Cilium provides sophisticated network policy capabilities that go beyond traditional Kubernetes NetworkPolicies, offering Layer 7 awareness and identity-based security.
Creating and Testing Network Policies
# Create a dedicated namespace for network policy testing
kubectl create namespace network-policy-test

# Deploy a basic CiliumNetworkPolicy
cat <<EOF > frontend-backend-policy.yaml
apiVersion: "cilium.io/v2"
kind: CiliumNetworkPolicy
metadata:
  name: "allow-frontend"
  namespace: network-policy-test
spec:
  endpointSelector:
    matchLabels:
      role: frontend
  ingress:
  - fromEndpoints:
    - matchLabels:
        role: backend
    toPorts:
    - ports:
      - port: "80"
        protocol: TCP
EOF

kubectl apply -f frontend-backend-policy.yaml
Application Deployment for Testing
# Frontend deployment with service
apiVersion: apps/v1
kind: Deployment
metadata:
  name: frontend
  namespace: network-policy-test
spec:
  replicas: 2
  selector:
    matchLabels:
      role: frontend
  template:
    metadata:
      labels:
        role: frontend
    spec:
      containers:
      - name: nginx
        image: nginx
        ports:
        - containerPort: 80
---
apiVersion: v1
kind: Service
metadata:
  name: frontend
  namespace: network-policy-test
spec:
  selector:
    role: frontend
  ports:
    - protocol: TCP
      port: 80
      targetPort: 80
---
# Backend pod for testing connectivity
apiVersion: v1
kind: Pod
metadata:
  name: backend
  namespace: network-policy-test
  labels:
    role: backend
spec:
  containers:
  - name: busybox
    image: busybox
    command: ['sh', '-c', 'echo Backend Pod is Running; sleep 3600']
Policy Testing and Validation
# Test connectivity from backend to frontend (should work)
kubectl exec -n network-policy-test -it backend -- wget -qO- http://frontend

# Create a test pod without the backend label (should be blocked)
kubectl run test-pod --image=busybox --namespace=network-policy-test -- sleep 3600

# Test connectivity from test-pod to frontend (should fail)
kubectl exec -n network-policy-test -it test-pod -- wget -qO- http://frontend
Advanced Policy Examples
# L7 HTTP policy with path-based routing
apiVersion: "cilium.io/v2"
kind: CiliumNetworkPolicy
metadata:
  name: "l7-http-policy"
  namespace: network-policy-test
spec:
  endpointSelector:
    matchLabels:
      app: api-server
  ingress:
  - fromEndpoints:
    - matchLabels:
        app: frontend
    toPorts:
    - ports:
      - port: "8080"
        protocol: TCP
      rules:
        http:
        - method: "GET"
          path: "/api/v1/.*"
        - method: "POST"
          path: "/api/v1/data"
---
# Database access policy with time-based restrictions
apiVersion: "cilium.io/v2"
kind: CiliumNetworkPolicy
metadata:
  name: "database-access-policy"
  namespace: network-policy-test
spec:
  endpointSelector:
    matchLabels:
      app: database
  ingress:
  - fromEndpoints:
    - matchLabels:
        app: webapp
    toPorts:
    - ports:
      - port: "3306"
        protocol: TCP
  - fromEndpoints:
    - matchLabels:
        app: admin-tools
    toPorts:
    - ports:
      - port: "3306"
        protocol: TCP
      rules:
        http:
        - headers:
          - "X-Admin-Token: .*"
Policy Monitoring and Troubleshooting
# View applied policies
c0 policy get

# Monitor policy enforcement in real-time
c0 monitor --type policy-verdict

# Check policy statistics
c0 bpf policy list <endpoint-id>

# Verify policy compilation
c0 policy validate <policy-file.yaml>
Hubble: Network Observability Platform
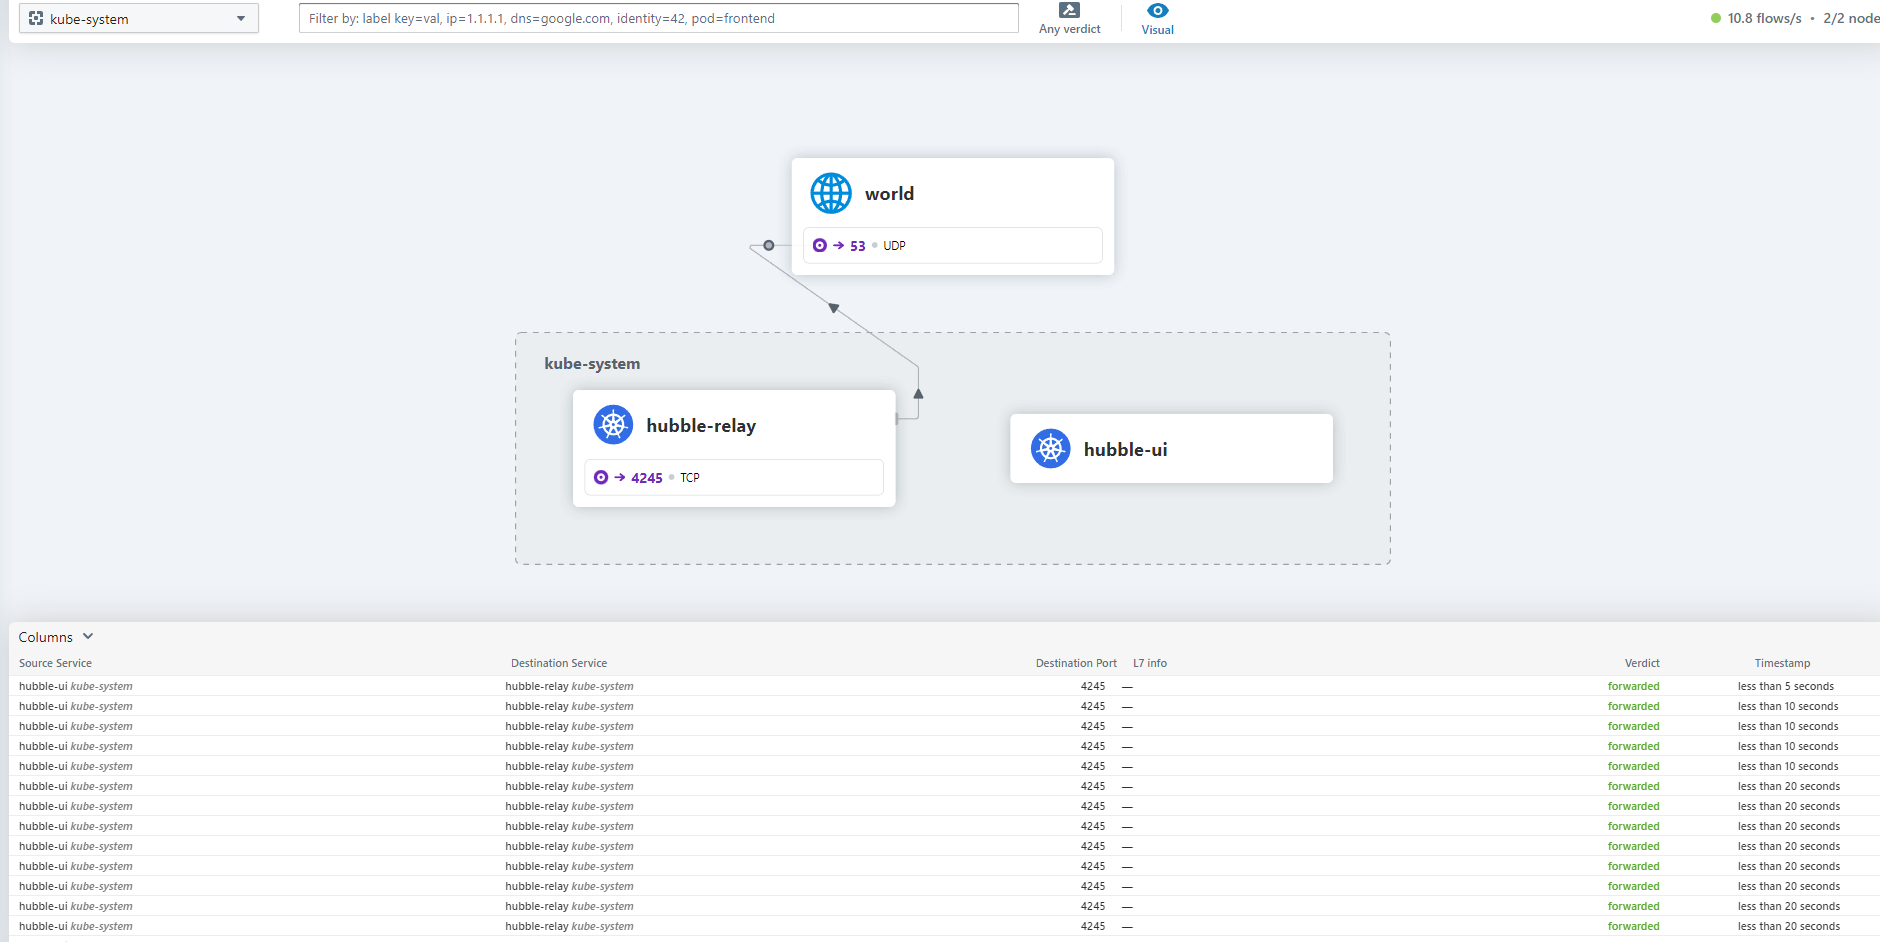
Hubble provides comprehensive network observability for Cilium-based clusters, offering real-time visibility into network traffic, security policies, and service dependencies.
Hubble Architecture
Hubble Configuration and Access
# Configure Hubble UI as NodePort for external access
kubectl patch -n kube-system svc hubble-ui -p '{"spec": {"type": "NodePort"}}'

# Verify service configuration
kubectl get svc -n kube-system hubble-ui

# Configure firewall rules (if needed)
# Add the NodePort to your firewall configuration

# Access Hubble UI via browser
# http://<node-ip>:<nodeport>
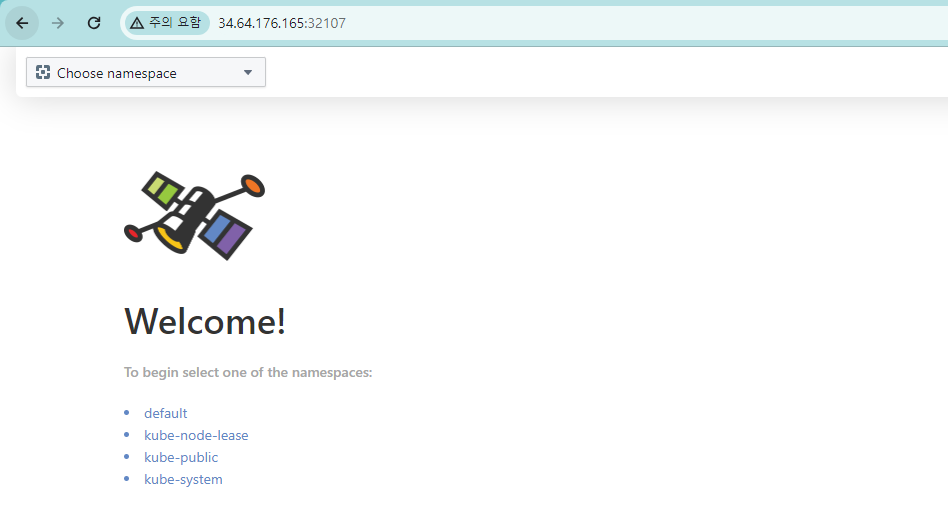
You can also select and view the namespace as shown below.
Hubble CLI Usage
# Install Hubble CLI
HUBBLE_VERSION=$(curl -s https://raw.githubusercontent.com/cilium/hubble/master/stable.txt)
curl -L --remote-name-all https://github.com/cilium/hubble/releases/download/$HUBBLE_VERSION/hubble-linux-amd64.tar.gz{,.sha256sum}
sha256sum --check hubble-linux-amd64.tar.gz.sha256sum
sudo tar xzvfC hubble-linux-amd64.tar.gz /usr/local/bin
rm hubble-linux-amd64.tar.gz{,.sha256sum}

# Port forward to Hubble Relay
kubectl port-forward -n kube-system svc/hubble-relay 4245:443 &

# Query flow data
hubble observe
hubble observe --namespace network-policy-test
hubble observe --pod frontend
hubble observe --protocol tcp --port 80

# Service topology
hubble observe --output json | jq '.flow.source.namespace,.flow.destination.namespace'

# Security policy violations
hubble observe --verdict DENIED
Flow Analysis and Debugging
| Hubble Command | Purpose and Output |
|---|---|
hubble observe |
Real-time flow observation with source, destination, and verdict information |
hubble observe --verdict DENIED |
Shows only flows that were denied by network policies |
hubble observe --namespace <ns> |
Filters flows for a specific namespace |
hubble observe --pod <pod> |
Shows flows involving a specific pod |
hubble observe --protocol <proto> |
Filters flows by protocol (tcp, udp, icmp) |
hubble status |
Shows Hubble server status and flow statistics |
Metrics and Monitoring Integration
# Prometheus configuration for Hubble metrics
apiVersion: v1
kind: ConfigMap
metadata:
  name: hubble-metrics-config
  namespace: kube-system
data:
  enabled-metrics: |
    dns:labelsContext=source_namespace,destination_namespace
    drop:labelsContext=source_namespace,destination_namespace
    tcp:labelsContext=source_namespace,destination_namespace
    flow:labelsContext=source_namespace,destination_namespace
    icmp:labelsContext=source_namespace,destination_namespace
    http:labelsContext=source_namespace,destination_namespace
Advanced Traffic Flow Analysis
Understanding traffic patterns and implementing comprehensive monitoring is crucial for maintaining secure and performant Kubernetes networks.
Network Interface Analysis
# Create a network debugging pod for detailed analysis
cat <<EOF | kubectl create -n network-policy-test -f -
apiVersion: v1
kind: Pod
metadata:
  name: netpod
  labels:
    app: netpod
spec:
  nodeName: test-server-agent
  containers:
  - name: netshoot-pod
    image: nicolaka/netshoot
    command: ["tail"]
    args: ["-f", "/dev/null"]
  terminationGracePeriodSeconds: 0
EOF

# Get pod IP for testing
NETPODIP=$(kubectl get pods netpod -n network-policy-test -o jsonpath='{.status.podIP}')

# Create alias for easy access
alias p0="kubectl exec -n network-policy-test -it netpod -- "

# Analyze network interfaces and routing
p0 ip -c route
p0 ip -c addr show
p0 ss -tulpn
CIDR and Network Configuration
# Check Cilium cluster CIDR configuration
kubectl get configmap -n kube-system cilium-config -o yaml | grep cluster-pool-ipv4-cidr

# Verify endpoint assignments
c1 endpoint list

# Analyze service mappings
c0 service list

# Monitor real-time traffic
c0 monitor --type trace
Comprehensive Policy Testing
# ICMP communication policy
apiVersion: "cilium.io/v2"
kind: CiliumNetworkPolicy
metadata:
  name: "allow-icmp-communication"
  namespace: network-policy-test
spec:
  endpointSelector:
    matchLabels:
      role: frontend
  ingress:
    - fromEndpoints:
        - matchLabels:
            app: netpod
      rules:
        icmp:
        - {}
---
apiVersion: "cilium.io/v2"
kind: CiliumNetworkPolicy
metadata:
  name: "allow-backend-communication"
  namespace: network-policy-test
spec:
  endpointSelector:
    matchLabels:
      role: backend
  ingress:
    - fromEndpoints:
        - matchLabels:
            app: netpod
      rules:
        icmp:
        - {}
Service Mesh Capabilities
Cilium provides service mesh functionality without sidecars, leveraging eBPF for efficient L7 processing.
# Service mesh policy with mTLS
apiVersion: "cilium.io/v2"
kind: CiliumNetworkPolicy
metadata:
  name: "service-mesh-policy"
  namespace: network-policy-test
spec:
  endpointSelector:
    matchLabels:
      app: microservice-a
  ingress:
  - fromEndpoints:
    - matchLabels:
        app: microservice-b
    toPorts:
    - ports:
      - port: "8080"
        protocol: TCP
      rules:
        http:
        - method: "GET|POST"
          path: "/api/.*"
        - headers:
          - "Authorization: Bearer .*"
      terminatingTLS:
        certificate: "service-cert"
        privateKey: "service-key"
Performance Monitoring and Optimization
# Monitor Cilium performance metrics
kubectl top pods -n kube-system -l k8s-app=cilium

# Check eBPF program performance
c0 bpf metrics list

# Analyze memory usage
c0 map list

# Monitor datapath latency
c0 monitor --type trace -v

# Service load balancing statistics
c0 service list --output json | jq '.[] | {id: .id, frontend: .frontend, backends: .backends}'
Production Deployment Considerations
Deploying Cilium in production environments requires careful planning for security, performance, scalability, and monitoring.
Security Hardening
| Security Area | Best Practices |
|---|---|
| Network Policies |
|
| Encryption |
|
| Identity Management |
|
Performance Tuning
# Cilium ConfigMap for production optimization
apiVersion: v1
kind: ConfigMap
metadata:
  name: cilium-config
  namespace: kube-system
data:
  # Performance settings
  preallocate-bpf-maps: "true"
  bpf-map-dynamic-size-ratio: "0.25"
  enable-endpoint-routes: "true"

  # Monitoring and observability
  enable-metrics: "true"
  prometheus-serve-addr: ":9090"

  # Security settings
  enable-policy: "default"
  policy-enforcement-mode: "default"

  # Networking configuration
  tunnel: "vxlan"
  enable-ipv4: "true"
  enable-ipv6: "false"

  # Load balancing
  enable-nodeport: "true"
  enable-external-ips: "true"
  kube-proxy-replacement: "strict"
Monitoring and Alerting
Troubleshooting and Debugging
Effective troubleshooting techniques are essential for maintaining healthy Cilium deployments and resolving network issues quickly.
Common Issues and Solutions
| Issue Category | Symptoms | Troubleshooting Steps |
|---|---|---|
| Connectivity Issues |
|
|
| Policy Issues |
|
|
| Performance Issues |
|
|
Diagnostic Commands
# Comprehensive health check
cilium status --verbose

# Network connectivity testing
cilium connectivity test

# Policy troubleshooting
cilium policy trace --src-endpoint <src-id> --dst-endpoint <dst-id>

# BPF program debugging
cilium bpf prog list
cilium bpf map list
cilium bpf policy get <endpoint-id>

# Log analysis
kubectl logs -n kube-system daemonset/cilium -f
kubectl logs -n kube-system deployment/cilium-operator -f

# Performance analysis
cilium monitor --type drop
cilium monitor --type trace -v
cilium metrics list
Key Points
- eBPF Foundation: Cilium's use of eBPF technology provides unprecedented performance and flexibility compared to traditional iptables-based solutions
- Comprehensive Security: Layer 3, 4, and 7 network policies with identity-based security and API-aware filtering capabilities
- Service Mesh Without Sidecars: Native service mesh functionality with load balancing, traffic management, and observability without performance overhead
- Advanced Observability: Hubble provides real-time network visibility, flow analysis, and security monitoring essential for complex distributed systems
- Production Readiness: Scalable architecture supporting large clusters with high-throughput networking and minimal operational overhead
- Kubernetes Integration: Seamless CNI plugin integration with native Kubernetes network policies and service discovery
- Performance Optimization: NUMA awareness, CPU pinning support, and optimized data paths for high-performance workloads
- Multi-Cloud Capability: Consistent networking across different cloud providers and on-premises infrastructure
Related Articles
- Kubernetes Network
- Kubernetes IPVS vs iptables
- Kubernetes Gateway API Complete Guide
- Kubernetes Headless Service
- Kubernetes Endpoint and EndpointSlice

Comments