15 min to read
Context Switch Deep Dive - The Hidden Performance Cost in Container Environments
Understanding the overhead behind multitasking and resource optimization strategies
Overview
Does the CPU really process multiple tasks simultaneously?
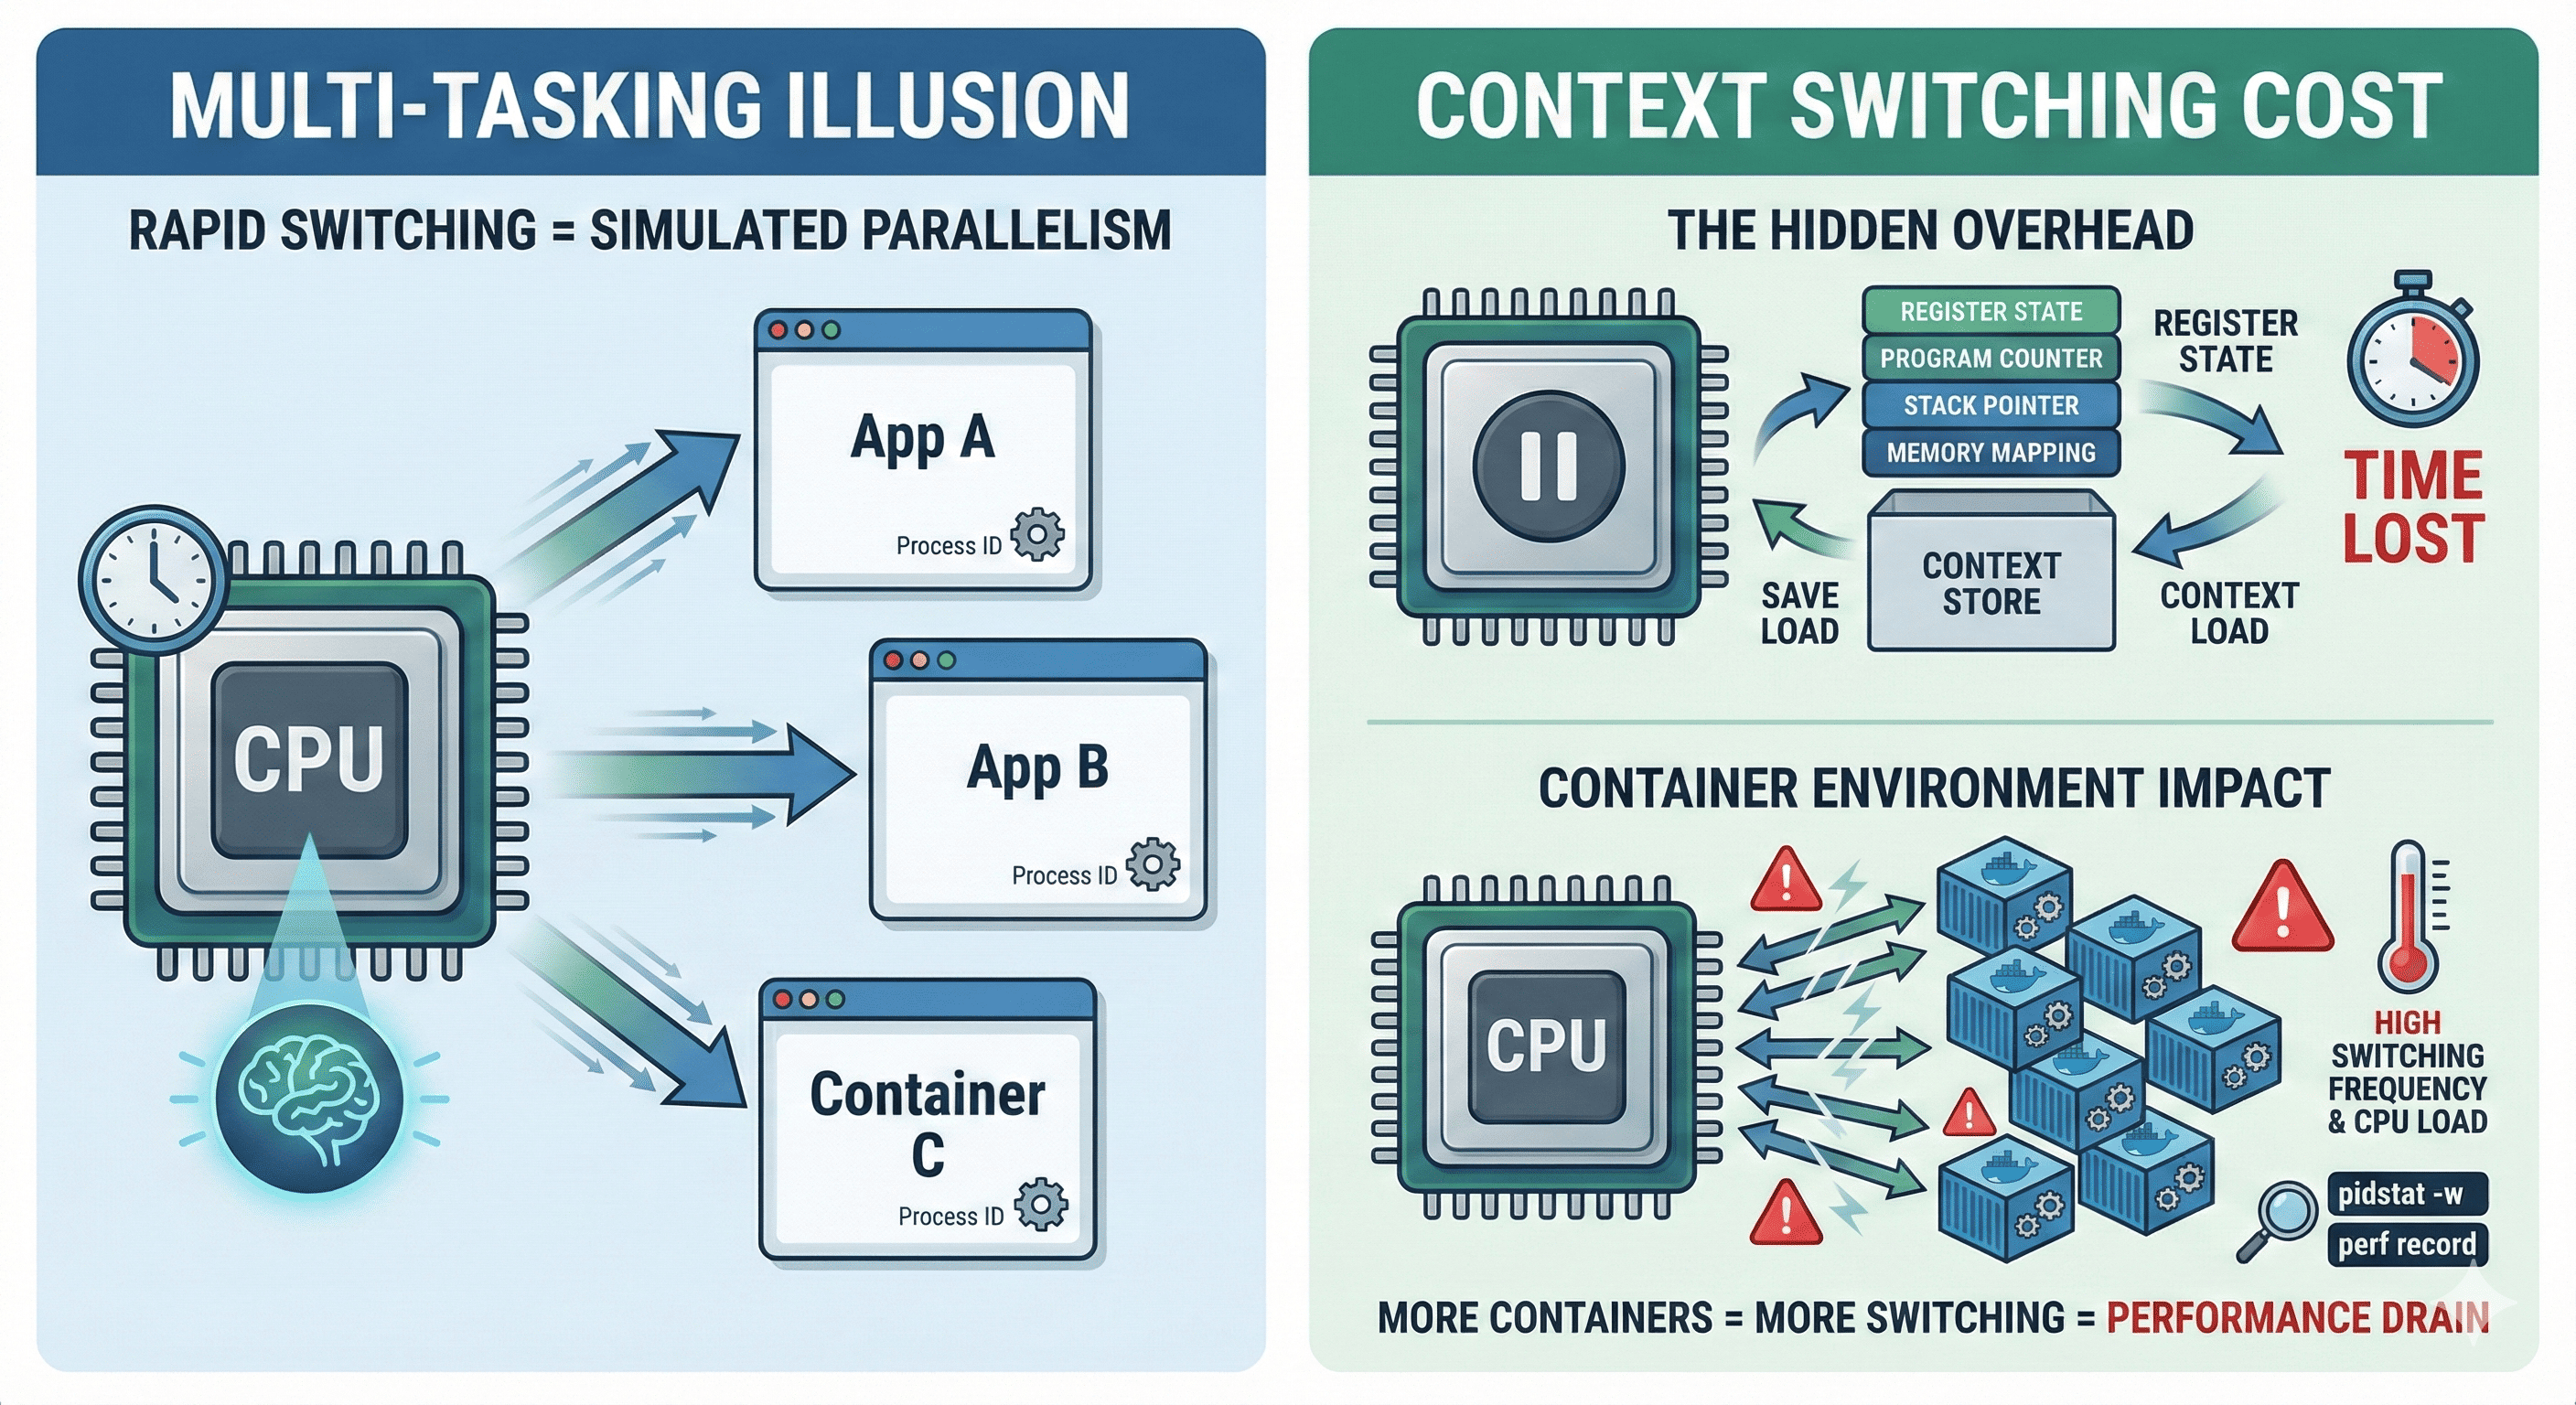
We take “multitasking” for granted as we run dozens of containers, processes, and threads concurrently every day. However, the CPU actually processes only one task at any given moment. The core technology that makes rapid task switching appear like true multitasking is called Context Switching.
But context switching isn’t free. As the number of containers increases and task switching becomes more frequent, the CPU spends more resources saving and restoring contexts rather than performing actual computations.
This article explores what Context Switching is, why it leads to performance degradation and resource waste in container environments, and how to reduce it effectively in production systems.
Does CPU Really Multitask?
The illusion of simultaneous execution is created by the CPU rapidly switching between tasks thousands of times per second. Each switch involves saving the current task’s state and loading another task’s state—this is context switching.
CPU Time Slicing: Rapid context switching creates the illusion of parallelism
What is Context Switching?
Context Switching is the operation where the CPU saves the state (context) of the currently running process or thread and switches to another task’s state. The OS manages this process, and the CPU rapidly switches from Task A → Task B, making it appear as if multiple tasks are running simultaneously.
Context Information Stored During Switching
| Component | Description | Impact on Performance |
|---|---|---|
| CPU Registers | General-purpose and special registers | Direct memory access overhead |
| Program Counter (PC) | Current instruction address | Pipeline flush required |
| Stack Pointer | Current stack position | Memory cache invalidation |
| Memory Mapping | Virtual memory translation tables | TLB (Translation Lookaside Buffer) flush |
| Process State | Running, waiting, blocked status | Scheduler overhead |
Why Container Environments Are More Sensitive
Container environments amplify context switching challenges due to their architecture and deployment patterns.
Web Server] DOCKER --> C2[Container 2
Database] DOCKER --> C3[Container 3
Cache] DOCKER --> C4[Container 4
Queue] DOCKER --> CN[Container N
Microservice] C1 --> P1[Process 1] C1 --> P2[Process 2] C2 --> P3[Process 3] C2 --> P4[Process 4] C3 --> P5[Process 5] C4 --> P6[Process 6] CN --> PN[Process N] style HOST fill:#ff6b9d,stroke:#333,stroke-width:3px style DOCKER fill:#4ecdc4,stroke:#333,stroke-width:2px style C1 fill:#95e1d3,stroke:#333,stroke-width:1px style C2 fill:#95e1d3,stroke:#333,stroke-width:1px style C3 fill:#95e1d3,stroke:#333,stroke-width:1px style C4 fill:#95e1d3,stroke:#333,stroke-width:1px style CN fill:#95e1d3,stroke:#333,stroke-width:1px
Container Architecture: Multiple containers create numerous processes competing for CPU time
1. Lightweight but Numerous Processes
Containers are lightweight, but they create many processes and threads. Dozens to hundreds of containers run simultaneously, each with their own processes competing for CPU resources. This leads to exponentially increased context switching frequency.
2. Multiple Containers = More Task Switching
The number of CPU cores is limited, and as container count increases, the scheduler must perform switches more frequently. When CPU-intensive tasks overlap, context switching overhead increases dramatically.
3. Additional Overhead from cgroups and namespaces
Container isolation technologies like cgroups and namespaces provide excellent isolation but add extra state management costs during context switches.
Performance Analysis: Monitoring Context Switches
Understanding how to measure and analyze context switching is crucial for optimization.
Using pidstat for Context Switch Monitoring
# Monitor context switches per second
pidstat -w 1
Sample Output:
Linux 6.8.0-55-generic (production-server)    01/31/26    _x86_64_    (8 CPU)

03:35:19   UID    PID   cswch/s nvcswch/s  Command
03:35:20     0     11      1.98      0.00  kworker/u4:0
03:35:20     0     17     29.70      0.00  rcu_preempt
03:35:20   999   1234      2.97      0.00  nginx
03:35:20   999   1235      3.96      0.00  nginx
03:35:20   994   1240      1.98      0.00  postgres
03:35:20   994   1241      4.95      0.00  postgres
03:35:20   992   1250      0.99      0.00  prometheus
03:35:20   995   1260     43.56      0.99  redis-server
Understanding Voluntary vs Non-voluntary Context Switches
| Type | Trigger | Performance Impact | Optimization Strategy |
|---|---|---|---|
| Voluntary (cswch/s) | Process voluntarily yields CPU (I/O wait, sleep) | Lower impact, predictable | Optimize I/O patterns, async processing |
| Non-voluntary (nvcswch/s) | Scheduler forcibly preempts process | High impact, cache invalidation | CPU affinity, priority tuning, load balancing |
High nvcswch/s values indicate CPU contention and potential performance bottlenecks.
Advanced Performance Monitoring
# Using perf for detailed analysis
sudo perf record -g
sudo perf report

# Monitor specific process
sudo perf record -p <PID> -g

# System-wide context switch analysis
vmstat 1

# Container-specific monitoring with cAdvisor
docker run --rm -p 8080:8080 -v /var/run:/var/run:ro -v /sys:/sys:ro -v /var/lib/docker/:/var/lib/docker:ro gcr.io/cadvisor/cadvisor:latest
Resource Waste and Performance Degradation Cases
Real-world scenarios where context switching becomes a bottleneck:
Common Bottleneck Patterns
- High CPU utilization with low actual throughput
- CPU appears busy but actual work completion is slow
- Often indicates excessive context switching overhead
- Response latency increases with container scale
- More containers lead to longer response times
- Scheduler overhead dominates execution time
- Idle container overhead
- Unnecessary containers consuming CPU cycles through context switches
- Background processes creating scheduling noise
Performance Degradation Cycle: How container proliferation leads to inefficiency
Production Optimization Strategies
Practical approaches to reduce context switching overhead in production environments.
1. CPU Affinity Configuration
Binding specific processes to specific CPU cores reduces inter-core context switches and improves cache locality.
# Bind process to specific CPU core
taskset -c 0 ./my_application

# Docker container with CPU affinity
docker run --cpuset-cpus="0,1" my-app

# Kubernetes CPU pinning
apiVersion: v1
kind: Pod
spec:
  containers:
  - name: app
    resources:
      requests:
        cpu: "1"
      limits:
        cpu: "1"
Kubernetes CPU Manager Policy:
# kubelet configuration
cpuManagerPolicy: static
Benefits:
- Maintains cache locality across context switches
- Reduces core-to-core migration overhead
- Improves deterministic performance
2. Container Optimization
| Strategy | Implementation | Impact |
|---|---|---|
| Eliminate Unnecessary Sidecars | Replace Fluentd sidecars with DaemonSet | Reduce process count by 50-80% |
| Consolidate Metrics Collection | Use node_exporter instead of per-pod exporters | Minimize scheduling overhead |
| InitContainer Pattern | Move setup tasks to initContainers | Reduce long-running process count |
| Resource Right-sizing | Match resource requests to actual usage | Improve scheduling efficiency |
3. CFS Quota and CPU Share Management
Linux Completely Fair Scheduler (CFS) can be tuned to reduce forced preemption.
# Kubernetes resource configuration
resources:
  requests:
    cpu: "500m"    # Soft limit
  limits:
    cpu: "1000m"   # Hard limit
# Direct cgroup configuration
echo 50000 > /sys/fs/cgroup/cpu/container/cpu.cfs_quota_us
echo 100000 > /sys/fs/cgroup/cpu/container/cpu.cfs_period_us
Benefits:
- Prevents CPU starvation
- Reduces non-voluntary context switches
- Enables predictable resource allocation
4. Process Priority and Nice Values
# Adjust process priority
nice -n 10 ./low_priority_task
nice -n -5 ./high_priority_task

# Real-time scheduling for critical processes
chrt -f 50 ./critical_process
Priority Levels:
-20to19for nice values (lower = higher priority)- Real-time policies:
SCHED_FIFO,SCHED_RR - Use sparingly to avoid system instability
5. Runtime and Language Optimization
| Runtime | Threading Model | Context Switch Impact | Use Case |
|---|---|---|---|
| Node.js | Single-threaded event loop | Low (for I/O), High (for CPU-bound) | API servers, real-time applications |
| Go | Goroutines (user-space threads) | Very Low | Concurrent services, microservices |
| Rust | Async/await with minimal runtime | Very Low | High-performance systems |
| Java/Python | Kernel threads | High | Enterprise applications (with tuning) |
| Nginx | Event-driven, non-blocking I/O | Very Low | Web servers, reverse proxies |
Multi-core CPU Cache Invalidation Issues
Understanding cache behavior during context switches is crucial for performance optimization.
Cache Invalidation: Cross-core context switches destroy cache locality
Solutions for Cache Optimization
CPU Pinning (taskset/cpuset):
# Pin process to specific cores
taskset -c 0-3 ./cpu_intensive_app

# Docker CPU pinning
docker run --cpuset-cpus="0-3" my-app
NUMA Awareness:
# Check NUMA topology
numactl --hardware

# Bind to specific NUMA node
numactl --cpunodebind=0 --membind=0 ./app
Kubernetes NUMA Alignment:
apiVersion: v1
kind: Pod
spec:
  containers:
  - name: app
    resources:
      requests:
        cpu: "4"
        memory: "8Gi"
      limits:
        cpu: "4"
        memory: "8Gi"
Kubernetes-specific Optimization
Container orchestration platforms require specialized approaches to context switch optimization.
CPU Manager Policy Configuration
# kubelet config
apiVersion: kubelet.config.k8s.io/v1beta1
kind: KubeletConfiguration
cpuManagerPolicy: static
cpuManagerReconcilePeriod: 10s
Requirements for CPU Pinning:
- Pod must have Guaranteed QoS class
- Integer CPU requests and limits
- Sufficient CPU resources on node
# Guaranteed QoS Pod example
apiVersion: v1
kind: Pod
spec:
  containers:
  - name: cpu-intensive-app
    resources:
      requests:
        cpu: "2"
        memory: "4Gi"
      limits:
        cpu: "2"
        memory: "4Gi"
Node Selector and Affinity
# Dedicate specific nodes for CPU-intensive workloads
apiVersion: v1
kind: Pod
spec:
  nodeSelector:
    workload-type: cpu-intensive
  affinity:
    nodeAffinity:
      requiredDuringSchedulingIgnoredDuringExecution:
        nodeSelectorTerms:
        - matchExpressions:
          - key: kubernetes.io/arch
            operator: In
            values:
            - amd64
Resource Management Best Practices
- Right-size Resource Requests: Match resource requests to actual application needs
- Use Vertical Pod Autoscaler: Automatically adjust resource requests based on usage
- Implement Pod Disruption Budgets: Ensure graceful scheduling during updates
- Monitor Resource Utilization: Use Prometheus metrics to track efficiency
Real-world Performance Case Study
Scenario: Microservices architecture with 100+ containers experiencing performance degradation despite adequate hardware resources.
Problem Identification
# Initial symptoms
- High CPU utilization (>80%) but low application throughput
- Increased response latency with scale
- Frequent non-voluntary context switches

# Monitoring revealed
pidstat -w 1 | grep -E "nvcswch|Command"
Results showed:
- 50+ containers with excessive non-voluntary context switches
- Multiple idle sidecars consuming CPU cycles
- Poor cache locality due to cross-core scheduling
Solution Implementation
| Action | Implementation | Result |
|---|---|---|
| Container Consolidation | Removed unnecessary Fluentd sidecars | 40% reduction in process count |
| CPU Affinity | Enabled CPU Manager Policy in Kubernetes | 60% reduction in cache misses |
| Resource Right-sizing | Implemented VPA recommendations | 30% improvement in scheduling efficiency |
| Runtime Optimization | Migrated Node.js services to Go | 50% reduction in context switches |
Overall Impact:
- 75% reduction in context switching overhead
- 2x improvement in application throughput
- 40% reduction in CPU utilization for same workload
Monitoring and Alerting Strategy
Implementing comprehensive monitoring for context switching metrics is essential for maintaining optimal performance.
Key Metrics to Monitor
# Prometheus alerting rules
groups:
- name: context_switching
  rules:
  - alert: HighContextSwitching
    expr: rate(node_context_switches_total[5m]) > 10000
    for: 2m
    labels:
      severity: warning
    annotations:
      summary: "High context switching rate detected"

  - alert: ExcessiveNonVoluntaryCS
    expr: rate(node_procs_blocked[5m]) > 100
    for: 1m
    labels:
      severity: critical
    annotations:
      summary: "Excessive non-voluntary context switches"
Performance Dashboard
# Key metrics for dashboards
- node_context_switches_total (rate)
- container_cpu_usage_seconds_total
- container_spec_cpu_quota
- node_load1, node_load5, node_load15
- container_cpu_cfs_throttled_seconds_total
Future Considerations and Emerging Technologies
eBPF for Context Switch Analysis
// eBPF program for context switch tracing
SEC("tracepoint/sched/sched_switch")
int trace_ctx_switch(struct trace_event_raw_sched_switch *ctx) {
    // Custom context switch analysis logic
    return 0;
}
Benefits:
- Zero-overhead production monitoring
- Detailed context switch causality analysis
- Custom metrics for specific workloads
User-space Threading Advances
Emerging runtime technologies are reducing kernel-level context switching:
- Goroutines in Go: M:N threading model
- Green threads in Rust: Tokio async runtime
- Fiber-based concurrency: User-space cooperative scheduling
Conclusion: Mastering the Hidden Performance Cost
Context switching represents one of the most significant hidden performance costs in modern container environments. While containers provide excellent isolation and deployment flexibility, they can introduce substantial scheduling overhead if not properly managed.
The key insight is that true system performance isn’t about maximizing CPU utilization—it’s about minimizing unnecessary work. Every context switch represents CPU cycles spent on bookkeeping rather than actual computation.
Key Takeaways for Production Systems:
- Monitor context switching metrics alongside traditional CPU utilization
- Implement CPU affinity for performance-critical workloads
- Eliminate unnecessary containers and consolidate where possible
- Choose runtime technologies that minimize kernel-level threading
- Right-size resource allocations to reduce scheduling conflicts
The Operational Mindset Shift
Modern container orchestration requires thinking beyond individual container performance to system-wide scheduling efficiency. The goal isn’t to run as many containers as possible—it’s to run the right containers efficiently.
As container adoption continues to grow and workloads become more complex, understanding and optimizing context switching becomes a critical skill for maintaining high-performance systems. The CPU should focus on computation, not constantly saving and restoring state.
Context switching optimization is not just performance tuning—it’s the foundation of sustainable, scalable container infrastructure.

Comments