31 min to read
AWS Monitoring Stack Complete Analysis - CloudWatch vs X-Ray vs 3rd Party Solutions
Unified monitoring architecture and alerting strategies for enterprise-grade observability systems
Overview
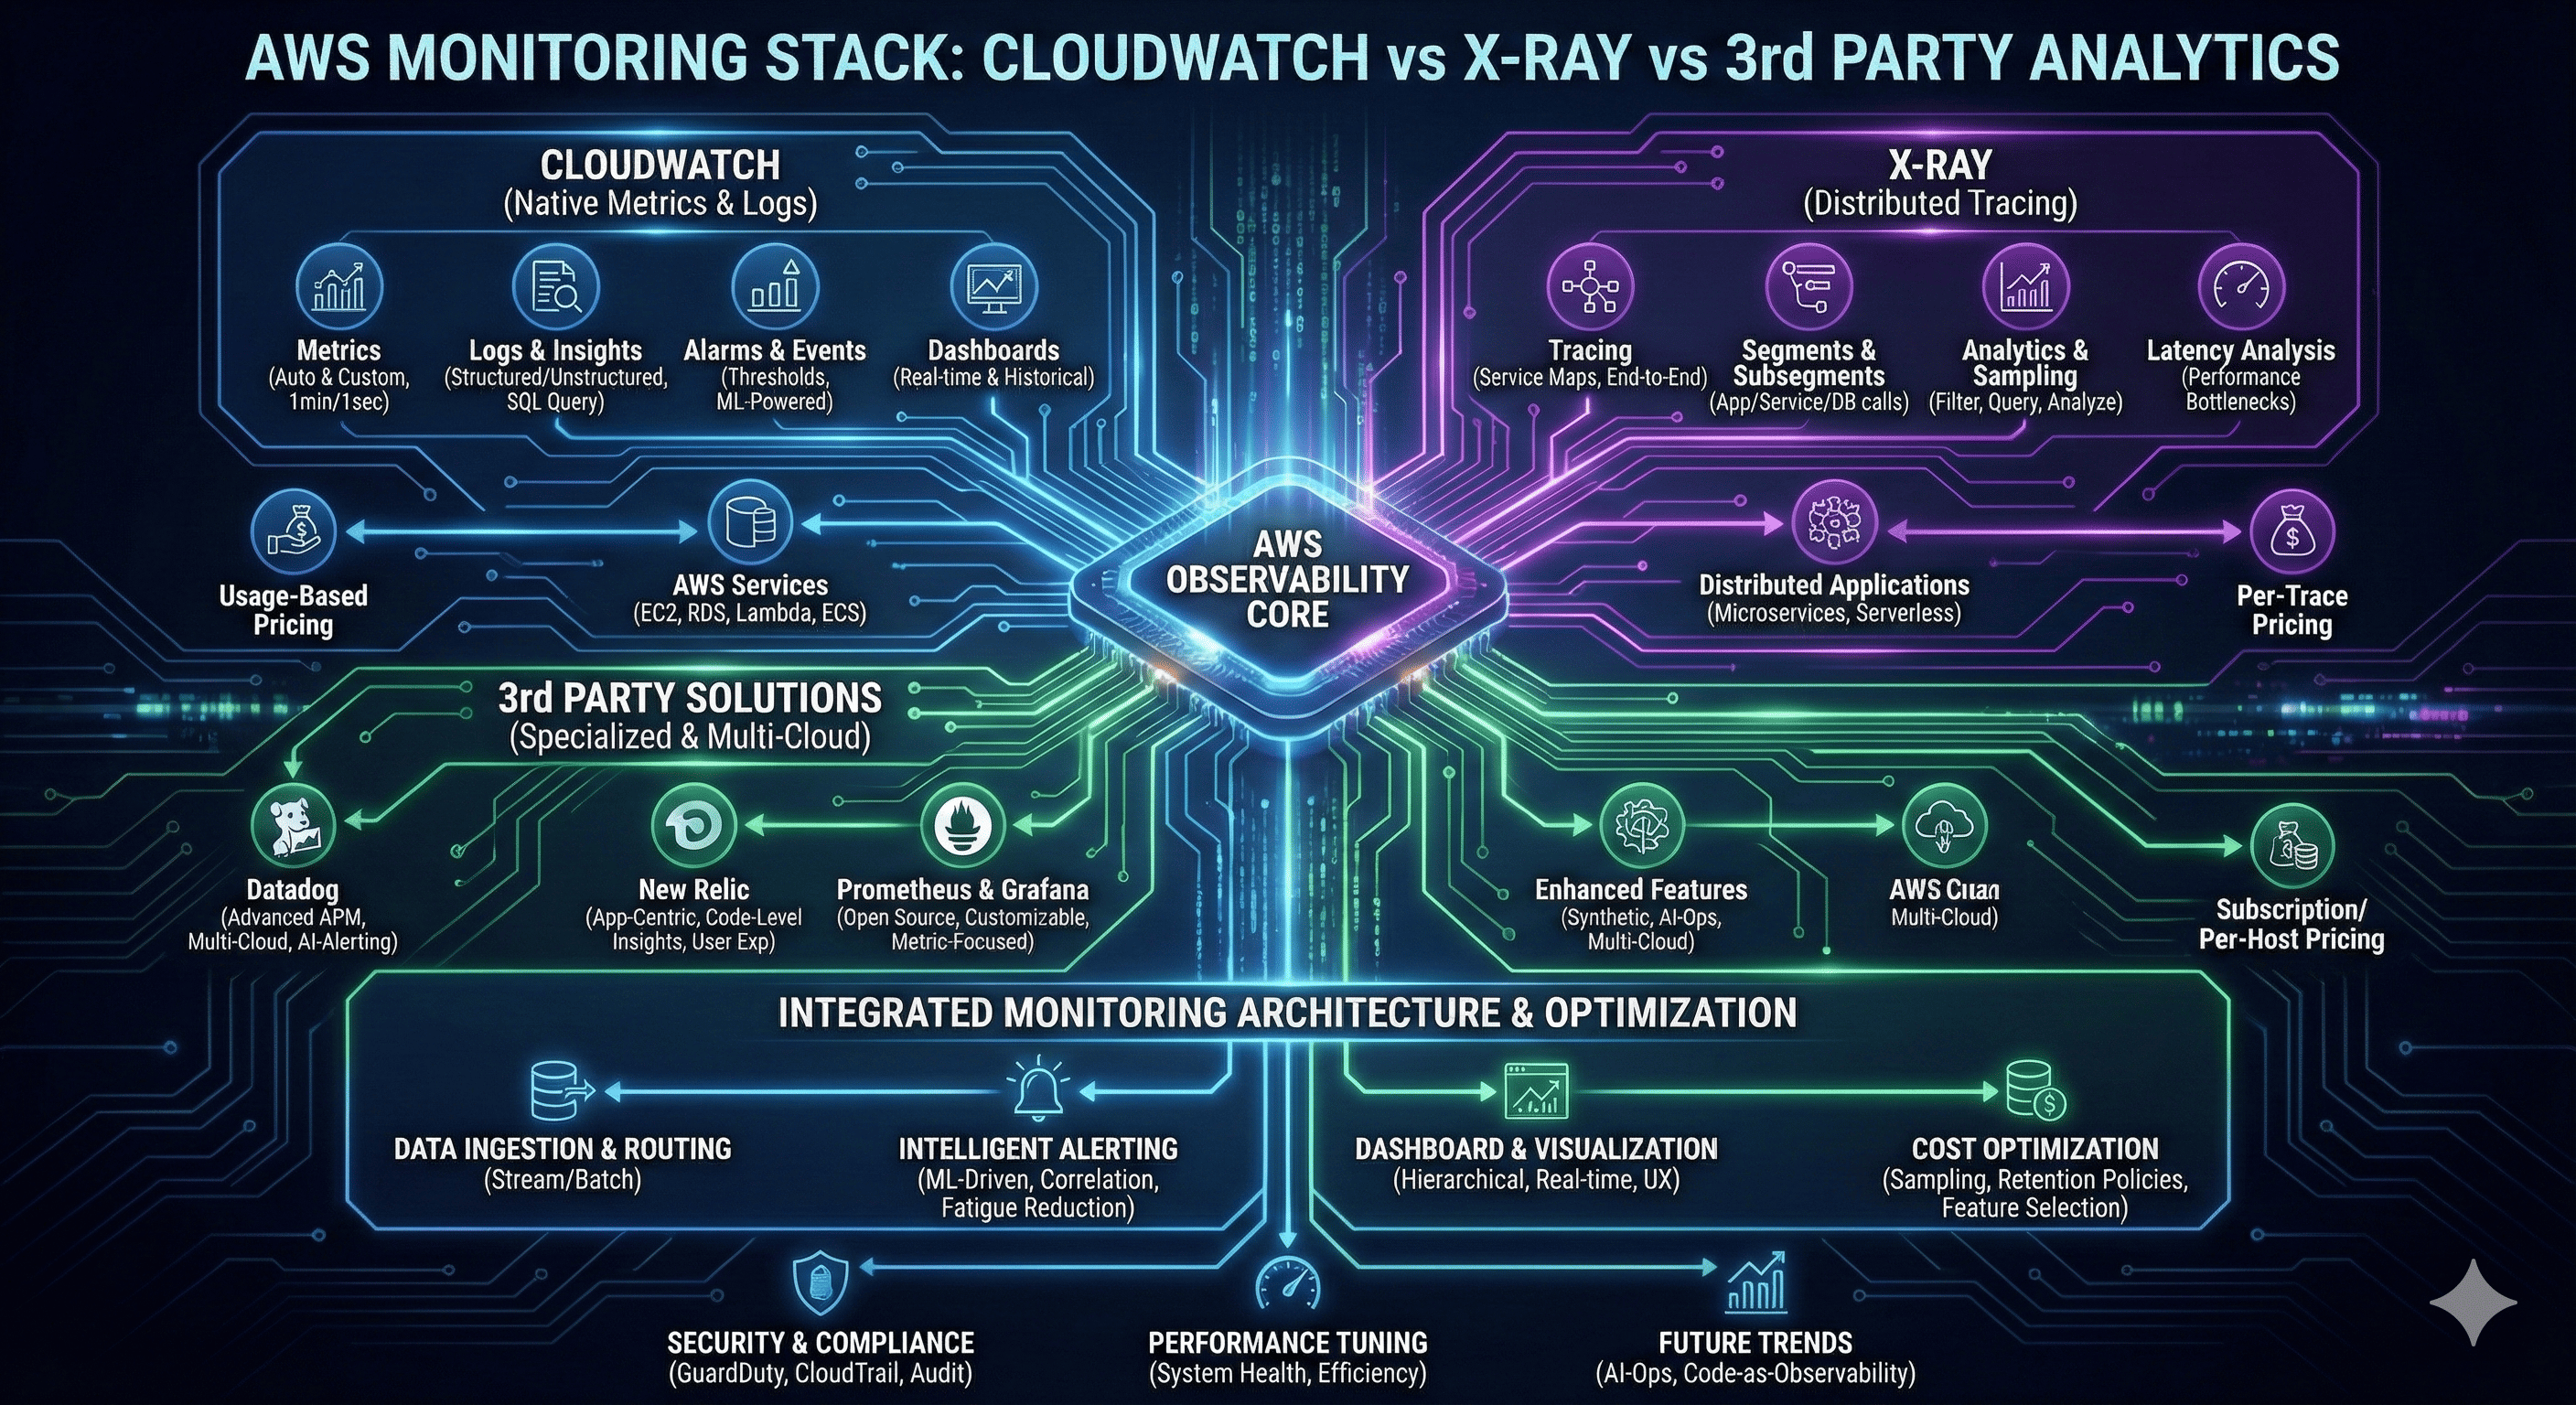
Modern cloud-native applications demand comprehensive monitoring and observability strategies that provide real-time insights into system performance, user experience, and operational health. AWS offers a robust ecosystem of native monitoring tools, while third-party solutions provide specialized capabilities and cross-cloud compatibility.
The monitoring landscape has evolved beyond simple metrics collection to encompass distributed tracing, application performance monitoring (APM), and intelligent alerting systems. Organizations must navigate the complexity of choosing between AWS-native solutions like CloudWatch and X-Ray, or integrating third-party platforms such as Datadog, New Relic, and Prometheus-based stacks.
This comprehensive analysis examines the technical capabilities, architectural patterns, and cost implications of different monitoring approaches. We explore how to build unified monitoring architectures that combine multiple tools effectively, implement intelligent alerting strategies that reduce noise while ensuring critical issues are detected promptly, and optimize costs across the entire monitoring stack.
AWS Native Monitoring Ecosystem
Amazon CloudWatch: Foundational Monitoring
CloudWatch serves as the central nervous system for AWS infrastructure monitoring, providing comprehensive metrics, logs, and alerting capabilities.
With deep integration across all AWS services, CloudWatch enables unified monitoring without additional agent deployment for most use cases.
Core Monitoring Capabilities
Amazon CloudWatch provides foundational monitoring capabilities that span infrastructure metrics, application logs, and custom business metrics. The service automatically collects metrics from AWS services without requiring additional configuration, providing immediate visibility into resource utilization, performance, and operational health.
CloudWatch’s strength lies in its seamless integration with the AWS ecosystem. Services like EC2, RDS, Lambda, and ECS automatically publish metrics to CloudWatch, enabling comprehensive monitoring without complex setup procedures. Custom metrics allow organizations to track business-specific KPIs alongside infrastructure metrics, creating holistic monitoring dashboards.
Metrics and Dimensional Data
CloudWatch organizes metrics using a dimensional model that enables sophisticated filtering and aggregation. Metrics include timestamps, values, and optional dimensions that provide context for data analysis. This structure supports complex queries and enables precise alerting on specific metric combinations.
| Metric Category | Collection Method | Granularity | Retention |
|---|---|---|---|
| AWS Service Metrics | Automatic | 1-minute standard | 15 months |
| Custom Application Metrics | API/SDK | 1-second to 1-day | 15 months |
| Detailed Monitoring | Enabled per service | 1-minute detailed | 15 months |
| High-Resolution Metrics | Custom publishing | 1-second resolution | 3 hours to 15 months |
CloudWatch Logs and Insights
CloudWatch Logs provides centralized log management with powerful search and analysis capabilities. Log Insights offers SQL-like queries for log analysis, enabling rapid troubleshooting and trend identification. The service supports structured and unstructured log formats with automatic parsing capabilities.
Log groups organize related log streams and provide retention policies, access controls, and subscription filters. Subscription filters enable real-time log streaming to other services like Kinesis, Lambda, or external systems for additional processing or archival.
Terraform Implementation for CloudWatch
AWS X-Ray: Distributed Tracing Excellence
X-Ray provides deep visibility into distributed applications through comprehensive tracing capabilities that reveal performance bottlenecks and service dependencies.
With automatic instrumentation for many AWS services and support for custom tracing, X-Ray enables detailed application performance analysis.
Distributed Tracing Architecture
AWS X-Ray captures and analyzes traces that represent complete request flows through distributed applications. Each trace consists of segments representing individual service calls, subsegments for downstream operations, and annotations that provide searchable metadata.
X-Ray’s service map automatically visualizes application architecture and service dependencies, revealing performance characteristics and failure patterns. This visual representation helps teams understand complex distributed systems and identify optimization opportunities.
Performance Analytics and Insights
X-Ray Analytics enables sophisticated queries on trace data to identify performance patterns, error trends, and service hotspots. The analytics engine supports filtering by response time, error status, service names, and custom annotations, enabling precise performance analysis.
Response time distribution analysis reveals performance characteristics across different percentiles, helping teams set realistic SLA targets and identify outlier requests that require investigation.
Integration Patterns and Instrumentation
X-Ray integrates with AWS services through automatic instrumentation and custom SDK implementations. Lambda functions, ECS containers, and EC2 instances can enable X-Ray tracing with minimal configuration changes.
| Service Type | Instrumentation Method | Configuration Effort | Data Granularity |
|---|---|---|---|
| Lambda Functions | Environment variable | Minimal | Function + downstream calls |
| ECS/Fargate | X-Ray daemon sidecar | Moderate | Container + subsegments |
| EC2 Instances | X-Ray daemon + SDK | Manual setup | Application + infrastructure |
| API Gateway | Built-in tracing | Configuration toggle | API calls + backends |
X-Ray Implementation with Terraform
# X-Ray service configuration
resource "aws_xray_encryption_config" "encryption" {
  type   = "KMS"
  key_id = aws_kms_key.xray_key.arn
}

# Lambda function with X-Ray tracing
resource "aws_lambda_function" "traced_function" {
  filename         = "function.zip"
  function_name    = "traced-microservice"
  role            = aws_iam_role.lambda_role.arn
  handler         = "index.handler"
  runtime         = "nodejs18.x"

  tracing_config {
    mode = "Active"
  }

  environment {
    variables = {
      _X_AMZN_TRACE_ID = ""
      AWS_XRAY_TRACING_NAME = "microservice-api"
      AWS_XRAY_CONTEXT_MISSING = "LOG_ERROR"
    }
  }

  tags = {
    Environment = "production"
    Tracing     = "enabled"
  }
}

# ECS service with X-Ray tracing
resource "aws_ecs_task_definition" "traced_service" {
  family                   = "traced-web-service"
  requires_compatibilities = ["FARGATE"]
  network_mode            = "awsvpc"
  cpu                     = "512"
  memory                  = "1024"
  execution_role_arn      = aws_iam_role.ecs_execution_role.arn
  task_role_arn          = aws_iam_role.ecs_task_role.arn

  container_definitions = jsonencode([
    {
      name  = "web-application"
      image = "your-account.dkr.ecr.us-west-2.amazonaws.com/web-app:latest"

      portMappings = [
        {
          containerPort = 8080
          protocol      = "tcp"
        }
      ]

      environment = [
        {
          name  = "AWS_XRAY_TRACING_NAME"
          value = "web-application"
        },
        {
          name  = "AWS_XRAY_DAEMON_ADDRESS"
          value = "xray-daemon:2000"
        }
      ]

      logConfiguration = {
        logDriver = "awslogs"
        options = {
          "awslogs-group"         = "/ecs/traced-web-service"
          "awslogs-region"        = "us-west-2"
          "awslogs-stream-prefix" = "ecs"
        }
      }
    },
    {
      name  = "xray-daemon"
      image = "amazon/aws-xray-daemon:latest"

      portMappings = [
        {
          containerPort = 2000
          protocol      = "tcp"
        }
      ]

      environment = [
        {
          name  = "AWS_REGION"
          value = "us-west-2"
        }
      ]

      logConfiguration = {
        logDriver = "awslogs"
        options = {
          "awslogs-group"         = "/ecs/xray-daemon"
          "awslogs-region"        = "us-west-2"
          "awslogs-stream-prefix" = "xray"
        }
      }
    }
  ])

  tags = {
    Environment = "production"
    Tracing     = "enabled"
  }
}

# X-Ray sampling rules for cost optimization
resource "aws_xray_sampling_rule" "high_priority_apis" {
  rule_name      = "HighPriorityAPIs"
  priority       = 1000
  version        = 1
  reservoir_size = 10
  fixed_rate     = 0.1
  url_path       = "/api/v1/critical/*"
  host           = "*"
  http_method    = "*"
  service_type   = "*"
  service_name   = "critical-api"
  resource_arn   = "*"

  tags = {
    Environment = "production"
    SamplingType = "critical"
  }
}

resource "aws_xray_sampling_rule" "background_jobs" {
  rule_name      = "BackgroundJobs"
  priority       = 5000
  version        = 1
  reservoir_size = 1
  fixed_rate     = 0.01
  url_path       = "*"
  host           = "*"
  http_method    = "*"
  service_type   = "*"
  service_name   = "background-processor"
  resource_arn   = "*"

  tags = {
    Environment = "production"
    SamplingType = "background"
  }
}
Third-Party Monitoring Solutions
Third-party monitoring platforms provide specialized capabilities, advanced analytics, and multi-cloud support that complement AWS native tools.
Solutions like Datadog, New Relic, and Prometheus offer unique features for specific monitoring requirements and organizational preferences.
Datadog: Comprehensive Observability Platform
Datadog provides end-to-end observability with advanced APM capabilities, infrastructure monitoring, and intelligent alerting. The platform excels in correlation analysis across metrics, traces, and logs, providing unified visibility into complex distributed systems.
Key differentiators include sophisticated anomaly detection, predictive analytics, and extensive integration ecosystem. Datadog’s synthetic monitoring capabilities enable proactive issue detection through simulated user transactions.
Core Capabilities:
- Unified Dashboard: Single pane of glass for all monitoring data
- Advanced APM: Deep application performance insights with code-level visibility
- Machine Learning: Automatic anomaly detection and trend analysis
- Synthetic Monitoring: Proactive monitoring through simulated transactions
- Security Monitoring: SIEM capabilities with threat detection
New Relic: Application-Centric Monitoring
New Relic focuses on application performance monitoring with detailed code-level insights and user experience analytics. The platform provides comprehensive error tracking, deployment impact analysis, and capacity planning capabilities.
New Relic’s strength lies in its application-centric approach, providing detailed visibility into application performance, database queries, and external service dependencies.
Distinctive Features:
- Error Analytics: Comprehensive error tracking with root cause analysis
- Deployment Tracking: Performance impact analysis for code deployments
- User Experience: Real user monitoring with performance insights
- Query Performance: Database performance analysis and optimization
- Kubernetes Monitoring: Container-native observability
Prometheus and Grafana: Open Source Excellence
Prometheus and Grafana provide powerful open-source monitoring capabilities with extensive customization options and active community support. This combination offers cost-effective monitoring with enterprise-grade features.
The Prometheus ecosystem includes AlertManager for intelligent routing, various exporters for metric collection, and extensive integration capabilities.
Comparative Analysis of Monitoring Solutions
| Solution | Strengths | Best Use Cases | Cost Model | Integration Effort |
|---|---|---|---|---|
| CloudWatch | Native AWS integration, automatic metrics | AWS-centric infrastructure | Pay-per-use | Minimal |
| X-Ray | Distributed tracing, service maps | Microservices debugging | Per-trace pricing | Moderate |
| Datadog | Advanced analytics, ML insights | Multi-cloud environments | Per-host subscription | Moderate |
| New Relic | Application-centric APM | Application performance focus | Per-user/data ingestion | Moderate |
| Prometheus/Grafana | Open source, customizable | Cost-sensitive deployments | Infrastructure costs only | High |
Unified Monitoring Architecture Design
Multi-Tier Monitoring Strategy
Enterprise monitoring architectures typically employ multi-tier strategies that combine different tools for specific purposes. This approach leverages each platform’s strengths while maintaining cost efficiency and operational simplicity.
The architecture segments monitoring responsibilities across infrastructure metrics, application performance, distributed tracing, and business intelligence, enabling specialized optimization for each layer.
Data Flow and Integration Patterns
Unified monitoring architectures require sophisticated data flow patterns that aggregate, correlate, and route monitoring data to appropriate analytics platforms. Event-driven architectures enable real-time processing while batch processing handles historical analysis and reporting.
Integration patterns must accommodate different data formats, sampling rates, and latency requirements across various monitoring tools and analytics platforms.
# Example monitoring data flow configuration
apiVersion: v1
kind: ConfigMap
metadata:
  name: monitoring-data-flow
data:
  flow-config.yaml: |
    data_sources:
      - name: cloudwatch_metrics
        type: aws_cloudwatch
        sampling_rate: 60s
        destinations: ["timestream", "datadog"]

      - name: xray_traces
        type: aws_xray
        sampling_rate: 0.1
        destinations: ["elasticsearch", "datadog"]

      - name: application_logs
        type: cloudwatch_logs
        destinations: ["elasticsearch", "s3_archive"]

    processors:
      - name: metric_aggregator
        input: cloudwatch_metrics
        operations:
          - aggregate: ["sum", "avg", "max"]
          - window: 5m
          - dimensions: ["service", "environment"]

      - name: trace_analyzer
        input: xray_traces
        operations:
          - extract_errors: true
          - calculate_percentiles: [50, 95, 99]
          - service_dependency_map: true

    destinations:
      - name: operational_dashboard
        sources: ["cloudwatch_metrics", "xray_traces"]
        platform: grafana
        update_frequency: 30s

      - name: business_intelligence
        sources: ["aggregated_metrics"]
        platform: quicksight
        update_frequency: 1h

      - name: alerting_engine
        sources: ["all"]
        platform: prometheus_alertmanager
        evaluation_frequency: 30s
Intelligent Alerting Strategies
Alert Fatigue Prevention
Modern alerting systems must balance sensitivity with practicality to prevent alert fatigue while ensuring critical issues receive immediate attention. Intelligent alerting employs machine learning, correlation analysis, and contextual information to reduce noise and improve signal quality.
Multi-level alerting strategies implement different notification channels and escalation procedures based on severity, business impact, and time sensitivity.
Dynamic Threshold Management
Static thresholds often generate false positives due to natural application variability and seasonal patterns. Dynamic threshold systems use historical data, machine learning algorithms, and contextual information to establish adaptive alerting criteria.
Anomaly detection algorithms identify unusual patterns that may indicate issues even when static thresholds are not breached, providing proactive issue detection capabilities.
| Alert Type | Detection Method | Response Time | Escalation Path |
|---|---|---|---|
| Critical System Failure | Static threshold + correlation | Immediate | On-call → Manager → Executive |
| Performance Degradation | Dynamic baseline + ML | 5 minutes | Team chat → On-call |
| Capacity Warning | Trend analysis + prediction | 30 minutes | Email → Team lead |
| Business Metric Anomaly | Statistical analysis | 1 hour | Dashboard → Stakeholders |
Terraform Implementation for Intelligent Alerting
# SNS topic configuration for different alert types
resource "aws_sns_topic" "critical_alerts" {
  name = "critical-alerts"

  tags = {
    Environment = "production"
    AlertType   = "critical"
  }
}

resource "aws_sns_topic" "warning_alerts" {
  name = "warning-alerts"

  tags = {
    Environment = "production"
    AlertType   = "warning"
  }
}

# Lambda function for intelligent alert processing
resource "aws_lambda_function" "alert_processor" {
  filename         = "alert-processor.zip"
  function_name    = "intelligent-alert-processor"
  role            = aws_iam_role.alert_processor_role.arn
  handler         = "index.handler"
  runtime         = "python3.9"
  timeout         = 300

  environment {
    variables = {
      SLACK_WEBHOOK_URL = var.slack_webhook_url
      PAGERDUTY_API_KEY = var.pagerduty_api_key
      ALERT_CORRELATION_WINDOW = "300"
    }
  }

  tags = {
    Environment = "production"
    Function    = "alert-processing"
  }
}

# CloudWatch anomaly detection for dynamic thresholds
resource "aws_cloudwatch_anomaly_detector" "response_time_anomaly" {
  metric_math_anomaly_detector {
    metric_data_queries {
      id = "m1"
      metric_stat {
        metric {
          metric_name = "ResponseTime"
          namespace   = "Application/Performance"
          dimensions = {
            Service = "microservice-api"
          }
        }
        period = 300
        stat   = "Average"
      }
    }
  }
}

resource "aws_cloudwatch_metric_alarm" "response_time_anomaly_alarm" {
  alarm_name          = "response-time-anomaly"
  comparison_operator = "LessThanLowerOrGreaterThanUpperThreshold"
  evaluation_periods  = "2"
  threshold_metric_id = "ad1"
  alarm_description   = "Response time anomaly detected"
  alarm_actions       = [aws_sns_topic.warning_alerts.arn]

  metric_query {
    id          = "m1"
    return_data = "true"
    metric {
      metric_name = "ResponseTime"
      namespace   = "Application/Performance"
      period      = 300
      stat        = "Average"
      dimensions = {
        Service = "microservice-api"
      }
    }
  }

  metric_query {
    id = "ad1"
    anomaly_detector {
      metric_math_anomaly_detector {
        metric_data_queries {
          id = "m1"
          metric_stat {
            metric {
              metric_name = "ResponseTime"
              namespace   = "Application/Performance"
              dimensions = {
                Service = "microservice-api"
              }
            }
            period = 300
            stat   = "Average"
          }
        }
      }
    }
  }

  tags = {
    Environment = "production"
    AlertType   = "anomaly"
  }
}

# Event-driven alert correlation
resource "aws_cloudwatch_event_rule" "alert_correlation" {
  name        = "alert-correlation-rule"
  description = "Correlate related alerts to reduce noise"

  event_pattern = jsonencode({
    source      = ["aws.cloudwatch"]
    detail-type = ["CloudWatch Alarm State Change"]
  })
}

resource "aws_cloudwatch_event_target" "alert_processor_target" {
  rule      = aws_cloudwatch_event_rule.alert_correlation.name
  target_id = "AlertProcessorTarget"
  arn       = aws_lambda_function.alert_processor.arn
}

resource "aws_lambda_permission" "allow_cloudwatch_events" {
  statement_id  = "AllowExecutionFromCloudWatchEvents"
  action        = "lambda:InvokeFunction"
  function_name = aws_lambda_function.alert_processor.function_name
  principal     = "events.amazonaws.com"
  source_arn    = aws_cloudwatch_event_rule.alert_correlation.arn
}
Alert Correlation and Suppression
Advanced alerting systems implement correlation engines that group related alerts and suppress redundant notifications. This reduces alert volume while maintaining visibility into system issues.
Correlation rules can group alerts by:
- Time Windows: Related alerts occurring within specific timeframes
- Service Dependencies: Alerts from dependent services or infrastructure
- Geographic Regions: Issues affecting specific regions or availability zones
- Impact Scope: Alerts affecting similar user segments or business functions
Dashboard Design Principles
Layered Information Architecture
Effective dashboard design employs layered information architecture that presents high-level summaries with drill-down capabilities for detailed analysis. Executive dashboards focus on business metrics and overall system health, while operational dashboards provide technical details for troubleshooting.
Dashboard Hierarchy:
- Executive Level: Business KPIs, SLA compliance, cost trends
- Operational Level: System metrics, performance indicators, alert status
- Technical Level: Detailed metrics, trace analysis, debug information
- Incident Response: Real-time diagnostics, correlation views, runbook integration
Real-Time vs Historical Analysis
Dashboard design must balance real-time monitoring requirements with historical analysis capabilities. Real-time dashboards enable immediate response to issues, while historical views support trend analysis, capacity planning, and post-incident reviews.
Visual Design and User Experience
Dashboard visual design significantly impacts user effectiveness and response times during incidents. Clear visual hierarchies, consistent color schemes, and intuitive navigation enable rapid information processing and decision-making.
Design Guidelines:
- Color Coding: Consistent color schemes for status indication (green/yellow/red)
- Information Density: Balanced information density avoiding cognitive overload
- Navigation: Intuitive navigation with contextual linking between related views
- Responsive Design: Mobile-friendly layouts for on-call engineers
- Accessibility: Color-blind friendly palettes and screen reader compatibility
Cost Optimization Strategies
AWS Native Cost Management
CloudWatch and X-Ray costs scale with data volume, metric frequency, and retention periods. Strategic cost optimization requires understanding pricing models and implementing appropriate data retention and sampling policies.
CloudWatch Cost Optimization:
- Metric Filtering: Publish only essential custom metrics
- Log Retention: Implement tiered retention policies
- Dashboard Optimization: Minimize widget count and refresh frequencies
- Reserved Capacity: Use CloudWatch Logs Reserved Capacity for predictable workloads
X-Ray Cost Optimization:
- Sampling Rules: Implement intelligent sampling to reduce trace volume
- Service Prioritization: Higher sampling for critical services, lower for background tasks
- Retention Management: Configure appropriate trace retention periods
- Regional Optimization: Deploy X-Ray in regions closest to applications
| Service | Cost Component | Optimization Strategy | Potential Savings |
|---|---|---|---|
| CloudWatch Metrics | Custom metrics ($0.30/metric/month) | Metric aggregation, filtering | 30-50% |
| CloudWatch Logs | Ingestion + storage | Log level filtering, retention policies | 40-60% |
| X-Ray Traces | Per trace recorded | Intelligent sampling rules | 50-80% |
| CloudWatch Dashboards | Per dashboard per month | Consolidated dashboards | 20-40% |
Third-Party Solution Cost Analysis
Third-party monitoring solutions typically employ subscription-based pricing models with costs scaling based on data volume, host count, or feature usage. Cost optimization requires careful feature selection and data volume management.
Cost Optimization Strategies:
- Feature Selection: Enable only required monitoring features
- Data Sampling: Implement sampling for high-volume, low-value data
- Retention Policies: Balance retention requirements with storage costs
- License Optimization: Right-size licenses based on actual usage patterns
Hybrid Architecture Cost Benefits
Hybrid monitoring architectures can achieve significant cost savings by leveraging each platform’s cost-effective capabilities while maintaining comprehensive coverage.
# Cost-optimized monitoring configuration
resource "aws_cloudwatch_log_group" "cost_optimized_logs" {
  for_each = {
    critical    = { retention = 90, class = "STANDARD" }
    important   = { retention = 30, class = "STANDARD" }
    general     = { retention = 7,  class = "INFREQUENT_ACCESS" }
    debug       = { retention = 3,  class = "INFREQUENT_ACCESS" }
  }

  name              = "/aws/application/${each.key}"
  retention_in_days = each.value.retention
  log_group_class   = each.value.class

  tags = {
    Environment = "production"
    LogLevel    = each.key
    CostTier    = each.value.class
  }
}

# Metric filtering for cost optimization
resource "aws_cloudwatch_log_metric_filter" "cost_optimized_errors" {
  name           = "CriticalErrorsOnly"
  log_group_name = aws_cloudwatch_log_group.cost_optimized_logs["critical"].name
  pattern        = "[timestamp, request_id, level=ERROR|FATAL, ...]"

  metric_transformation {
    name      = "CriticalErrors"
    namespace = "Application/Critical"
    value     = "1"
  }
}

# X-Ray sampling for cost control
resource "aws_xray_sampling_rule" "cost_optimized_sampling" {
  rule_name      = "CostOptimizedSampling"
  priority       = 9000
  version        = 1
  reservoir_size = 1
  fixed_rate     = 0.05  # 5% sampling for general traffic
  url_path       = "*"
  host           = "*"
  http_method    = "*"
  service_type   = "*"
  service_name   = "*"
  resource_arn   = "*"

  tags = {
    Environment = "production"
    CostTier    = "optimized"
  }
}
Advanced Monitoring Patterns
Synthetic Monitoring and User Experience
Synthetic monitoring proactively tests application functionality and performance from external vantage points, enabling detection of issues before they impact real users. This approach complements reactive monitoring with predictive capabilities.
Implementation strategies include:
- API Health Checks: Automated testing of critical API endpoints
- User Journey Simulation: Complete user workflow testing
- Geographic Distribution: Testing from multiple global locations
- Performance Baselines: Establishing performance expectations for different scenarios
Chaos Engineering Integration
Modern monitoring systems integrate with chaos engineering practices to validate system resilience and monitoring effectiveness. Controlled failure injection tests monitoring system responsiveness and alert accuracy.
Machine Learning Enhanced Monitoring
Advanced monitoring platforms increasingly incorporate machine learning for anomaly detection, predictive analytics, and intelligent alerting. These capabilities reduce manual threshold management while improving issue detection accuracy.
ML Applications in Monitoring:
- Anomaly Detection: Statistical analysis for unusual pattern identification
- Predictive Scaling: Forecasting resource requirements based on historical patterns
- Root Cause Analysis: Correlation analysis for rapid issue identification
- Alert Optimization: Dynamic threshold adjustment based on historical performance
Security and Compliance Monitoring
Security Event Correlation
Monitoring systems must integrate security event detection with operational monitoring to provide comprehensive threat visibility. Security monitoring encompasses access patterns, configuration changes, and anomalous behavior detection.
Integration with AWS security services enables comprehensive threat detection:
- GuardDuty Integration: Threat detection with monitoring correlation
- CloudTrail Analysis: API activity monitoring and anomaly detection
- Config Compliance: Configuration drift detection and alerting
- Security Hub: Centralized security finding management
Compliance and Audit Requirements
Enterprise monitoring systems must accommodate compliance requirements including data retention, access controls, and audit trails. Different compliance frameworks impose specific monitoring and reporting requirements.
Compliance Considerations:
- Data Retention: Long-term storage for audit requirements
- Access Logging: Comprehensive access trail maintenance
- Change Tracking: Configuration and code change correlation
- Report Generation: Automated compliance reporting capabilities
Performance Tuning and Optimization
Monitoring System Performance
Monitoring systems themselves require performance optimization to handle high data volumes without impacting application performance. This includes efficient data collection, processing, and storage strategies.
Performance Optimization Areas:
- Data Collection: Efficient agent configuration and sampling strategies
- Processing Pipeline: Stream processing for real-time analysis
- Storage Optimization: Tiered storage based on access patterns
- Query Performance: Indexed data structures for rapid analysis
Scaling Monitoring Infrastructure
As applications grow, monitoring infrastructure must scale accordingly. This requires planning for data volume growth, geographic distribution, and increased complexity.
# Monitoring infrastructure scaling configuration
apiVersion: v1
kind: ConfigMap
metadata:
  name: monitoring-scaling-config
data:
  scaling-strategy.yaml: |
    data_retention:
      hot_storage: 7d
      warm_storage: 30d
      cold_storage: 365d

    sampling_strategies:
      high_volume_services:
        sample_rate: 0.01
        burst_capacity: 1000
      critical_services:
        sample_rate: 1.0
        burst_capacity: unlimited
      background_services:
        sample_rate: 0.001
        burst_capacity: 100

    processing_capacity:
      real_time_processing: 10000 events/second
      batch_processing: 1M events/minute
      storage_throughput: 100GB/hour

    geographic_distribution:
      primary_region: us-west-2
      secondary_regions: [us-east-1, eu-west-1]
      data_replication: async
      failover_strategy: automated
Future Trends and Evolution
Observability as Code
The monitoring landscape evolves toward “observability as code” where monitoring configurations, dashboards, and alerting rules are version-controlled and deployed through CI/CD pipelines. This approach enables consistent monitoring across environments and rapid deployment of monitoring changes.
Key Concepts:
- Configuration Management: Version-controlled monitoring configurations
- Dashboard as Code: Programmatic dashboard generation and maintenance
- Alert Rule Management: Automated alert rule deployment and testing
- Monitoring Testing: Validation of monitoring configurations before deployment
AI-Driven Operations (AIOps)
Artificial intelligence increasingly enhances monitoring capabilities through intelligent pattern recognition, predictive analytics, and automated response systems. AIOps platforms reduce manual intervention while improving issue detection and resolution speed.
Edge Monitoring and IoT
As computing moves closer to users through edge deployments and IoT devices, monitoring systems must adapt to distributed architectures with intermittent connectivity and resource constraints.
Edge Monitoring Challenges:
- Connectivity: Intermittent network availability
- Resource Constraints: Limited compute and storage capacity
- Data Aggregation: Efficient edge-to-cloud data transmission
- Local Decision Making: Edge-based alerting and response capabilities
Implementation Best Practices
Monitoring Strategy Development
Successful monitoring implementation begins with comprehensive strategy development that aligns monitoring objectives with business requirements and technical constraints.
Strategy Components:
- Stakeholder Requirements: Understanding different user needs and expectations
- Technical Architecture: Aligning monitoring with system architecture
- Cost Considerations: Balancing monitoring value with operational costs
- Scalability Planning: Designing for future growth and complexity
Team Organization and Responsibilities
Effective monitoring requires clear organizational structure and responsibility distribution across development, operations, and business teams.
Organizational Patterns:
- Centralized Monitoring Team: Dedicated team managing monitoring infrastructure
- Embedded Monitoring: Monitoring responsibilities distributed across product teams
- Hybrid Approach: Central platform with team-specific customizations
- Site Reliability Engineering: SRE teams owning end-to-end reliability
Continuous Improvement Process
Monitoring systems require continuous evaluation and improvement to maintain effectiveness as applications and infrastructure evolve.
Conclusion
The AWS monitoring landscape offers sophisticated options for building comprehensive observability solutions that meet diverse organizational requirements. CloudWatch provides foundational monitoring with deep AWS integration, X-Ray enables detailed distributed tracing for complex microservices architectures, and third-party solutions offer specialized capabilities and multi-cloud support.
Success in monitoring implementation requires strategic thinking beyond tool selection. Organizations must design unified architectures that leverage each platform’s strengths while maintaining cost efficiency and operational simplicity. Intelligent alerting strategies reduce noise while ensuring critical issues receive appropriate attention, and well-designed dashboards enable rapid decision-making across different organizational levels.
Cost optimization remains a critical consideration as monitoring systems scale with application growth. Strategic use of sampling, retention policies, and feature selection can significantly reduce operational costs while maintaining monitoring effectiveness. Hybrid approaches that combine AWS native tools with third-party solutions often provide optimal cost-performance ratios.
The future of monitoring trends toward AI-enhanced capabilities, edge computing support, and observability-as-code practices. Organizations that invest in flexible, scalable monitoring architectures will be well-positioned to adapt to these evolving requirements while maintaining operational excellence.
Effective monitoring transforms from a reactive necessity into a proactive enabler of system reliability, user experience optimization, and business insight generation. The tools and strategies outlined in this analysis provide the foundation for building world-class monitoring systems that support both current operational needs and future growth objectives.
References
- Amazon CloudWatch User Guide
- AWS X-Ray Developer Guide
- AWS Well-Architected Framework - Reliability Pillar
- CloudWatch Pricing
- X-Ray Pricing
- Datadog AWS Integration Guide
- New Relic Infrastructure Monitoring
- Prometheus Monitoring System
- Grafana Documentation
- AWS Observability Best Practices
- OpenTelemetry Documentation
- Site Reliability Engineering - Google

Comments